What the Ionosphere Actually Is
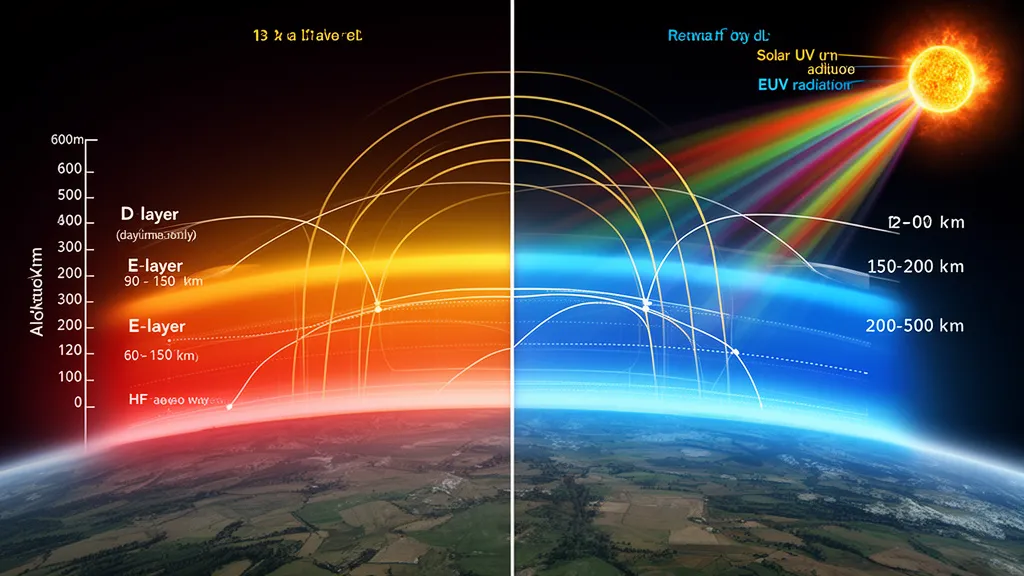
The ionosphere is the electrically charged region of Earth’s upper atmosphere, extending from approximately 60 km to 1,000 km altitude, produced by solar ultraviolet (UV) and extreme ultraviolet (EUV) radiation ionizing gas molecules. Solar photons strip electrons from neutral atoms and molecules, creating a plasma — a mixture of free electrons, positive ions, and residual neutral gas.
These free electrons give the ionosphere its remarkable electromagnetic properties. A region containing free electrons has a refractive index for radio waves that depends on electron density: the more electrons per cubic metre, the lower the refractive index at a given frequency. This gradient in refractive index is what causes radio waves to bend within the ionosphere — not a sudden reflection off a sharp boundary, but a gradual curve through a medium with continuously changing electromagnetic properties.
Without the ionosphere, HF radio (3–30 MHz) would be limited to line-of-sight paths, just as VHF and UHF are. Every DX contact you make on 20m, every gray-line QSO on 40m, every 10m opening to the Pacific — all of it depends on this region of ionized upper atmosphere sustained by the Sun.
Why Radio Waves Bend in the Ionosphere
The physical mechanism behind ionospheric refraction is described by the Appleton-Hartree equation — a relationship between electron density, magnetic field strength, and wave frequency that determines the refractive index of an ionized medium (Davies, 1990). The simplified version, adequate for most HF propagation analysis, relates refractive index (n) to electron density (N) and wave frequency (f):
n² ≈ 1 − (Ne²)/(4π²ε₀mf²)
where N is electron density (electrons/m³), e is electron charge, ε₀ is permittivity of free space, and m is electron mass. As electron density N increases, n² decreases, meaning n < 1. A wave moving from a low-electron-density region into a high-density region experiences a decreasing refractive index — and like light entering a less-dense medium, it bends away from the gradient direction (toward Earth, in this case).
For this bending to return the wave to Earth, the wave must be:
- Below the critical frequency (for vertical incidence) or below the MUF (for oblique paths)
- Travelling at an angle that allows the cumulative refraction to complete the arc before the wave exits the ionosphere through the density peak
For frequencies above the critical frequency at vertical incidence, the wave passes through the electron density maximum and continues into space. This is why VHF signals (144 MHz and above) pass straight through the ionosphere — the electron density in any realistic ionospheric layer is too low to bend those wavelengths back.
Critical Frequency and MUF
foF2 is the critical frequency of the F2 layer — the highest frequency reflected vertically. It is a direct measure of the peak electron density of the F2 layer. Typical daytime values range from 5 MHz (deep solar minimum, winter) to 12 MHz (solar maximum, summer).
For oblique paths — all long-distance propagation — the geometry allows higher frequencies. The relationship is:
MUF ≈ foF2 × sec(θ)
where θ is the elevation angle of the radio wave at the ionospheric reflection point (ITU-R P.1240-2). At θ = 60° (a typical angle for long-distance paths), sec(60°) = 2, meaning the MUF is approximately twice foF2. This is why 10m (28 MHz) can propagate via F2 even when foF2 is only 10–12 MHz — the oblique geometry provides the necessary factor.
The practical implication: longer paths have access to higher MUF values, all else being equal. A 5,000 km path from the US East Coast to Europe will have a higher MUF than a 1,500 km path within North America on the same day with the same ionospheric conditions.
Layer Structure: The Four Regions
The ionosphere is not a single uniform layer. Solar ionization creates a vertical structure of distinct layers, each produced by different radiation types at different altitudes.
D Layer: 60–90 km
The D layer is the lowest ionospheric layer and forms during daylight hours only. It is ionized primarily by solar Lyman-alpha radiation (121.6 nm UV) ionizing nitric oxide (NO) molecules, and by soft X-rays ionizing molecular nitrogen and oxygen.
The D layer does not reflect HF signals — it absorbs them. Free electrons at D-layer altitudes collide with gas molecules much more frequently than at higher altitudes (because the atmospheric density is greater). Each collision dissipates some energy from the radio wave into heat. The absorption is frequency-dependent: lower frequencies suffer more absorption than higher ones, roughly following a 1/f² law.
Practical consequences:
- 80m (3.5 MHz) during the day: severe D-layer absorption on steep angles; ground-wave covers 100–200 km, but sky-wave on short paths is nearly impossible
- 40m (7 MHz) during the day: moderate absorption; NVIS is degraded but not eliminated at solar zenith
- 20m (14 MHz) and above: D-layer absorption is much less severe
The D layer disappears within 30–45 minutes of local sunset because it requires continuous solar ionization to sustain electron density against rapid recombination. When it disappears, 80m and 40m immediately become long-distance bands.
E Layer: 90–150 km
The E layer forms during daylight at 90–150 km, ionized primarily by solar soft X-rays (1–10 nm) that are absorbed at these altitudes. It is present daytime and weakens at night, though a residual E layer persists due to ionization by cosmic rays and other non-solar sources.
The normal daytime E layer supports HF propagation at relatively short distances (typically 200–2,000 km, with 2-hop extending to 4,000 km). Its foE (critical frequency) is typically 2–4 MHz in the daytime, too low to support most HF bands directly at vertical incidence.
The E layer is also responsible for sporadic-E (Es) — thin, highly ionized clouds that appear at approximately 100–110 km altitude at unpredictable times and durations. Es clouds can have foEs values of 10 MHz or higher, enabling single-hop propagation up to 2,500 km on 10m, 6m, and even 2m FM. The formation mechanism remains incompletely understood; wind shear in the mesosphere is the dominant theory, but meteoric ion trails and other processes are also implicated (Davies, 1990).
Es is most common in the Northern Hemisphere from May through August, with a smaller secondary peak in November–December. In the Southern Hemisphere, the season shifts six months. Duration can be minutes to hours; a typical Es opening lasts 30–90 minutes before fading.
F1 Layer: 150–200 km
The F1 layer exists only during daylight hours at mid-to-high solar activity. It occupies the altitude range 150–200 km and is ionized primarily by far-UV radiation. At low solar activity or during nighttime, F1 and F2 merge into a single F layer.
From an operational standpoint, the F1 layer contributes modestly to daytime propagation at some frequencies but is never the primary propagation mode. Most propagation prediction models treat it as part of the F-region complex rather than analyzing it separately. The ITU-R P.533 model incorporates the F1 layer in its calculations for the daytime F-layer MUF estimation, but operators do not need to track it independently.
F2 Layer: 200–500 km
The F2 layer is the most important ionospheric layer for HF propagation. It extends from approximately 200 km to well above 500 km at the peak electron density altitude, and is ionized primarily by extreme ultraviolet (EUV) radiation (10–100 nm) that is completely absorbed in this altitude range.
At these altitudes, the atmospheric density is so low that recombination of ions and electrons is slow — meaning electron density persists for many hours after the ionizing radiation is removed. This is why the F2 layer does not disappear at night like the D and E layers do. Instead, its electron density slowly declines from the daytime peak over a period of 4–8 hours after sunset, reaching a nighttime minimum before recovering at the next sunrise.
The peak electron density of the F2 layer — and therefore the foF2 value — varies strongly with:
- Solar flux (SFI): Higher SFI means more EUV output, more ionization, higher foF2. The relationship is approximately linear for moderate solar activity and sublinear at very high SFI.
- Time of day: foF2 peaks in the early-to-mid afternoon local time (roughly 14:00–16:00 LT) and reaches a minimum around 04:00–06:00 LT.
- Season: At mid-latitudes, foF2 is higher in summer at the equinoxes than in winter. The so-called “winter anomaly” means high-latitude F2 is sometimes stronger in winter daytime than would be expected from solar angle alone — a complex effect of upper atmosphere chemistry and dynamics.
- Geomagnetic activity: Geomagnetic storms suppress foF2 through heating and compositional changes in the thermosphere. A Kp 6 storm can reduce foF2 by 20–40% at high latitudes for 12–24 hours.
Day-Night Transition: What Changes and Why
The transition between daytime and nighttime ionospheric conditions is rapid. Within roughly 30 minutes of local sunset, the D layer is gone, the E layer weakens substantially, and the F1 layer has merged into a declining F2. Within 1–2 hours, the bands that rely on daytime ionization (10m, 15m under moderate SFI) close, while the bands constrained by daytime D-layer absorption (80m, 40m) open up.
The gray line — the narrow zone along the sunset and sunrise terminators — creates a brief window of unique propagation. At the gray line, the D layer is disappearing or has just disappeared, but the F2 layer retains its daytime ionization level for an additional 30–60 minutes. The result: for a short time, the D-layer absorption is minimal while the F2 layer is still at its maximum daytime electron density. Long-distance 80m and 40m paths along or near the gray line experience very low absorption losses simultaneously at both ends if both stations are near the terminator. Gray-line operators seek this window for working rare DX on the low bands.
The reverse happens at sunrise: as solar ionization builds, the D layer forms and begins absorbing 80m/40m sky-wave signals. Operators on the morning gray line have a brief window before D-layer absorption shuts down the long paths they were using overnight.
The key insight for gray-line operating: both the transmitting and receiving station need to be near the terminator at the same time for maximum benefit. A 40m path from New England to Japan runs almost exactly along the gray line at one specific time each morning. That window lasts roughly 20–30 minutes — set an alarm and be ready on frequency before it opens.
Solar Cycle Effects on Ionospheric Propagation
The 11-year solar cycle drives long-term variation in ionospheric electron density. At solar maximum, the Sun produces substantially more EUV output, which pushes foF2 to higher values globally and supports higher MUF on all paths.
At solar maximum (SFI routinely above 150):
- foF2 at mid-latitudes regularly exceeds 10–12 MHz
- 10m (28 MHz) MUF is routinely exceeded on mid-latitude DX paths
- 6m F2 propagation is possible on long paths at low latitudes
- The ionosphere supports consistent 24-hour propagation on 20m and even 15m on some paths
At solar minimum (SFI near 70):
- foF2 drops to 5–7 MHz on mid-latitude paths
- 10m MUF is rarely reached except on equatorial paths
- 15m openings are limited to the best mid-latitude paths at solar noon
- 20m and 40m become the reliable DX bands
- 80m becomes increasingly important for regional and inter-continental nighttime paths
Solar Cycle 25 reached its predicted maximum in 2025, with SFI frequently exceeding 200 SFU during peak months. The next solar minimum is projected in the early 2030s. Operators active during this declining phase will notice gradual deterioration of 10m conditions over the next several years.
Total Electron Content: The Integrated Measure
Total electron content (TEC) is a measure of the total number of electrons in a column of ionosphere with a 1 m² cross-section, measured in TECU (10¹⁶ electrons/m²). It is used in GPS correction calculations, satellite link budgets, and ionospheric research.
For HF operators, TEC provides a useful integrated view of ionospheric state. High TEC days correlate with high foF2 and high MUF. NOAA and NASA publish real-time TEC maps derived from GPS receiver networks. These maps show the global TEC distribution — useful for identifying where the ionosphere is most strongly ionized on a given day.
A practical use: if you are trying to determine whether propagation is available on a path over a poorly instrumented ocean region, a TEC map can give you a rough estimate of F2 layer strength along that path even without direct foF2 soundings.
Chapman Production Function: Why Layers Form Where They Do
The altitude at which maximum ionization occurs for a given type of radiation is described by the Chapman production function. Solar photons of a given wavelength are attenuated exponentially as they travel through the atmosphere. At high altitude, very few photons have been absorbed (so there are few ion-electron pairs produced). Deep in the atmosphere, most photons of that wavelength have been absorbed (so there are also few pairs produced, because the radiation has run out). Maximum production occurs at the altitude where the product of photon flux and target gas density is maximized — this creates the characteristic ionization peak at a specific altitude for each radiation type.
The practical consequence: each type of solar radiation creates its own layer at a characteristic altitude. Lyman-alpha creates the D layer at 60–90 km; soft X-rays create the E layer at 90–150 km; EUV creates the F layer at 150–500 km. This altitude structure is why the ionosphere has distinct layers rather than being uniformly ionized throughout.
The Chapman function also explains why ionospheric layers are stronger at lower solar zenith angles (closer to solar noon) — at higher sun angles, the photons travel through less atmosphere before reaching the layer altitude, meaning less pre-absorption and more ionization.
Frequently Asked Questions
What is the ionosphere and why does it matter for radio?
The ionosphere is the region of Earth’s upper atmosphere, 60–1,000 km altitude, ionized by solar UV and EUV radiation. It contains free electrons that reduce the refractive index for radio waves, causing HF signals to bend back toward Earth rather than travelling in a straight line into space. Without the ionosphere, HF radio would be limited to line-of-sight range, eliminating all long-distance DX propagation on frequencies below about 30 MHz.
How does the ionosphere change at night?
At night, the D layer disappears (no solar ionization, rapid recombination), the E layer weakens substantially, and F1 merges with F2. The F2 layer loses electron density slowly over 4–8 hours after sunset due to ongoing recombination. Nighttime foF2 is lower than daytime, meaning the MUF drops. Bands requiring high MUF (10m, 15m) close; bands constrained by daytime D-layer absorption (80m, 40m) open for long-distance propagation.
What causes sporadic-E?
Sporadic-E (Es) forms when thin, highly ionized clouds develop in the E layer at approximately 100–110 km altitude. The dominant theory is wind shear — horizontal wind layers moving in opposite directions at slightly different altitudes converge metallic ions (from meteoric ablation) into thin, dense patches. These patches can have foEs values above 10 MHz, enabling 10m, 6m, and occasionally 2m propagation at distances of 1,000–2,500 km. Es is most common in the Northern Hemisphere from May through August.
Why are some HF paths blocked during a geomagnetic storm?
Geomagnetic storms heat and expand the thermosphere, altering the ratio of atomic to molecular oxygen at F2 altitudes. Molecular recombination is faster, reducing F2 electron density and foF2 — lowering the MUF. At polar latitudes, energetic particle precipitation during storms creates additional ionization at D and E altitudes, causing polar cap absorption (PCA) that completely blocks HF signals on polar-crossing paths. A Kp 7 storm can produce 10–20 dB of extra absorption on paths crossing above 75° latitude.
What is the maximum usable frequency (MUF)?
The MUF is the highest frequency that will be refracted back to Earth on a specific path at a specific time. It is calculated from foF2 and path geometry using MUF ≈ foF2 × sec(θ), where θ is the incident angle at the F2 layer. The MUF changes continuously with solar conditions, time of day, and season. Operating near the MUF gives the strongest signals because absorption is lowest at higher frequencies, but a drop in MUF below your operating frequency will shut the path down suddenly.
For the practical application of ionospheric physics to band selection, read Ham Radio Propagation for Beginners. For the key solar metrics that drive ionospheric conditions, see How to Read Solar Data Like a Pro.