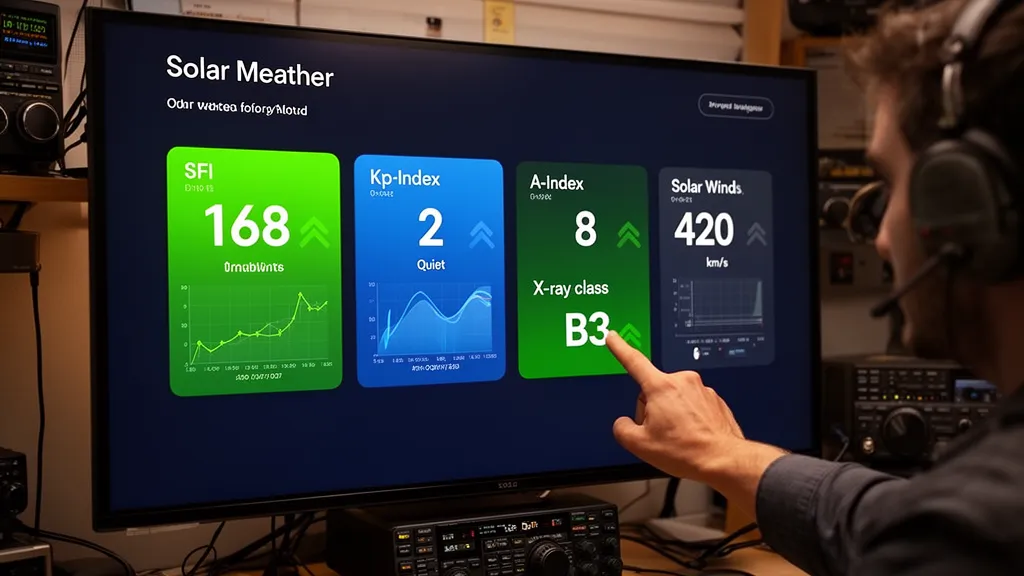
Operator's Verdict: SFI is 104 SFU, Kp is 0, and current X-ray class is B3.5. Open the solar weather dashboard for the full picture including solar wind and A-index.
Reading Solar Data in 30 Seconds Flat
Five numbers determine whether your HF bands will perform well today: SFI (ionization level), Kp (geomagnetic disturbance), A-index (yesterday's geomagnetic summary), X-ray class (active flares), and solar wind Bz (storm warning indicator). Master what each one means and you can evaluate today's propagation potential before your coffee goes cold.
The DXRadar solar weather dashboard shows all five in real time. This guide explains what each number measures, how they interact, and how to turn them into actionable band choices.
SFI — The Ionization Meter
SFI (Solar Flux Index) is a daily measurement of the Sun's radio emission at 2800 MHz (10.7 cm wavelength), reported in Solar Flux Units (SFU). Think of it as a proxy for the Sun's UV output — the radiation that ionizes the F2 layer and determines how high the Maximum Usable Frequency (MUF) can climb.
The practical range for amateur radio purposes runs from about 65 SFU (deep solar minimum, virtually no sunspot activity) to 250 SFU or higher during solar maximum peaks. The current Solar Cycle 25 maximum saw values frequently above 200 SFU in late 2024 and 2025.
What SFI tells you:
| SFI | Meaning for HF |
|---|---|
| Below 80 SFU | Low bands (40m, 80m) reliable; 20m works regionally; 15m and 10m closed via F2 |
| 80–100 SFU | 20m solid globally; 15m opens midday on good paths; 10m rare |
| 100–120 SFU | 20m excellent; 15m strong for DX; 10m possible on equatorial paths |
| 120–150 SFU | 10m opens reliably; 15m and 12m very productive |
| 150+ SFU | All bands open; 10m to multiple continents simultaneously |
One important nuance: the ionosphere has a 48-hour lag in responding to SFI changes. Today's F2 conditions reflect the average solar output over roughly the past two days, not just today's single measurement. A rising SFI trend over several days is more meaningful than one high reading.
The DXRadar solar weather page shows a 27-day SFI trend. Watch for recurring peaks at 27-day intervals — this is the solar rotation period. Active regions often return to Earth-facing orientation on a 27-day cycle, creating predictable windows of better high-band conditions.
Kp — The Storm Alarm
Kp (planetary K-index) is a 0–9 scale measuring global geomagnetic disturbance, updated every three hours by NOAA SWPC. It measures perturbations in Earth's magnetic field caused by the interaction of the solar wind with the magnetosphere (NOAA SWPC, Geomagnetic Storms).
Lower Kp is always better for HF propagation. The K-index uses a quasi-logarithmic scale: each step represents roughly double the disturbance energy of the previous step, so Kp 5 is dramatically more disruptive than Kp 3.
| Kp | Storm Level | Effect on HF Propagation |
|---|---|---|
| 0–2 | Quiet | Excellent; no significant degradation |
| 3 | Unsettled | Slight degradation possible on very high-latitude paths |
| 4 | Active | Minor storm; polar-route paths (transpolar DX, Arctic paths) noticeably degraded |
| 5–6 | G1–G2 Minor/Moderate | Significant degradation on paths above ~50° latitude; high bands weakened |
| 7–8 | G3–G4 Strong/Severe | Widespread HF disruption; polar blackouts; 20m marginal; 40m NVIS still works |
| 9 | G5 Extreme | Near-complete HF blackout on high-latitude paths; aurora visible at low latitudes |
The mechanism behind Kp degradation: geomagnetic disturbances heat and expand the upper atmosphere, increasing ion-electron recombination rates and temporarily reducing F2 layer electron density. Energetic particles during severe storms also penetrate deep into the polar ionosphere, causing polar cap absorption (PCA) — a blackout of HF signals on paths crossing the polar cap, independent of the D-layer.
A critical point: Kp degradation is geographically selective. A Kp 6 storm devastates transpolar paths (for example, Tokyo to Stockholm via the North Pole) while leaving equatorial and mid-latitude paths between 30°N and 30°S largely intact. If your target path runs through equatorial regions, high Kp matters less than if you are chasing a rare Svalbard station.
A-Index — Yesterday's Report Card
The A-index is a linear daily scale summarizing the previous 24 hours of geomagnetic activity. It is derived from the eight 3-hour K-index readings by converting each K value to an equivalent linear "ap" value, averaging the eight ap values, and reporting the result as the daily A-index.
A-index values and their interpretation (ARRL, HF Propagation):
| A-index | Activity Level |
|---|---|
| 0–7 | Quiet |
| 8–15 | Unsettled |
| 16–29 | Active |
| 30–49 | Minor storm |
| 50–99 | Major storm |
| 100+ | Severe storm |
The A-index is useful for understanding what the ionosphere experienced yesterday, which affects today's residual conditions. If the A-index is 50 or higher, the ionosphere is still recovering even if current Kp has dropped back to 2 — F2 conditions may be below normal for 12–36 hours after a major storm.
The A-index is also what most older propagation forecasts and contest advisory bulletins report. When the ARRL W1AW propagation bulletin says "A=15, K=3," you are reading yesterday's summary and the current 3-hour reading.
Why Not Just Use Kp?
Kp is a real-time snapshot of a 3-hour window. A-index provides context: a Kp reading of 3 means something different if yesterday's A-index was 5 (recovering from quiet) versus 80 (the storm just peaked and this is the tail end). Use both together.
X-Ray Class — The Flare Warning
X-ray class describes the current intensity of solar flare activity, measured by GOES satellites monitoring the 1–8 Ångstrom X-ray band (NOAA SWPC, Solar Flares). The scale uses letter grades:
| Class | X-ray Flux | Radio Effect |
|---|---|---|
| A | < 10⁻⁷ W/m² | Background; no significant radio effect |
| B | 10⁻⁷ – 10⁻⁶ W/m² | Very minor; usually undetectable |
| C | 10⁻⁶ – 10⁻⁵ W/m² | Minor D-layer enhancement; possible slight degradation on 10–15 MHz |
| M | 10⁻⁵ – 10⁻⁴ W/m² | Moderate blackout; degradation below 15 MHz for 10–60 minutes |
| X | > 10⁻⁴ W/m² | Strong to extreme blackout; potential HF blackout on entire sunlit hemisphere |
Within each class, numbers provide finer gradation: an M2.5 flare is 2.5 times the M-class base flux. An X3 flare is three times the X-class base. An X9 is nine times — a rare, major event.
The radio blackout effect operates via sudden D-layer ionization. The intense X-ray pulse from a flare reaches Earth in 8 minutes, ionizes the D layer rapidly, and absorbs HF signals on the sunlit side of Earth. The blackout is most severe on the hemisphere facing the Sun at the time of the flare and affects low frequencies (below 10 MHz) more than high frequencies. 160m and 80m blackouts can last 30+ minutes even on modest M-class flares.
After the flare X-ray flux decays below C-class levels, the D layer returns to normal within 30–90 minutes and propagation gradually recovers. The DXRadar X-ray chart shows current flux in real time so you can see exactly where in the recovery curve you are.
Solar Wind Speed and Bz — The Storm Forecast
Solar wind speed (km/s) and Bz (the north-south component of the interplanetary magnetic field, in nanoTesla) are the early-warning indicators for geomagnetic storms. They are measured by the DSCOVR and ACE satellites at the Sun-Earth L1 Lagrange point, about 1.5 million km sunward — giving roughly 15–60 minutes of warning before the solar wind reaches Earth.
Solar wind speed: Background solar wind is typically 300–500 km/s. A coronal mass ejection (CME) arrives as a sheath of faster solar wind — commonly 500–800 km/s, with extreme events exceeding 1,000 km/s. Fast solar wind alone is not necessarily dangerous; it is the magnetic field orientation (Bz) that matters more.
Bz (IMF Bz): This is the critical number. When the interplanetary magnetic field is oriented northward (positive Bz), it does not couple efficiently with Earth's magnetic field, and geomagnetic activity remains low regardless of solar wind speed. When Bz turns negative (southward), it couples with the magnetosphere and drives geomagnetic storms.
| Bz | Effect |
|---|---|
| 0 to +10 nT | Northward or neutral; minimal geomagnetic activity |
| 0 to −5 nT | Weakly southward; possible minor activity |
| −5 to −10 nT | Active conditions possible; watch Kp trend |
| −10 to −20 nT | Minor to moderate storm likely; Kp 4–6 expected |
| Below −20 nT | Severe storm; Kp 7+ possible; major HF disruption |
The key operational rule: when Bz goes strongly negative and solar wind speed is elevated (above 500 km/s), Kp will rise within the next 30–60 minutes. This is your warning to expect degraded conditions. Check the DXRadar solar weather dashboard — when Bz is shown as a large negative value alongside elevated wind speed, a storm is in progress or imminent.
How the Numbers Interact: Real-World Scenarios
Solar data is most useful when you read the combination, not individual numbers in isolation.
Scenario A: SFI 160, Kp 1, X-ray background A-class This is the combination every DX chaser dreams of. Strong ionization, quiet geomagnetic field, no active flares. All bands are productive. 10m should be open for hours during daylight. 15m and 17m will be excellent. Even 6m may show F2 openings. If you have a DXpedition on the log, today is the day to make the contact.
Scenario B: SFI 120, Kp 5, X-ray background B-class Mixed picture. The SFI suggests good high-band ionization, but Kp 5 indicates a G1 minor storm in progress. High-latitude paths (transpolar, Arctic) will be degraded — signals on those paths will be weaker, more variable, and the MUF lower than the SFI would imply. Equatorial paths may still perform near-normally. Focus on 20m and 40m for most paths; skip high-latitude targets for today.
Scenario C: SFI 80, Kp 2, M1 flare in decay Below-average ionization with a recovering flare. The M1 flare peaked 45 minutes ago; check the X-ray chart to see if flux has dropped below C-class. Until it does, frequencies below 10 MHz on the sunlit hemisphere will have elevated D-layer absorption. On the night side of Earth, you are unaffected. 40m nightside and 20m on paths avoiding the sunlit hemisphere will still work.
Scenario D: SFI 95, Kp 1, solar wind Bz −15 nT The SFI and current Kp look moderate, but that Bz value is a warning. Kp will likely rise in the next hour as the geomagnetic response catches up to the solar wind. This is not the time to start a marathon DX session on 10m. Check back in 2 hours once the Kp response is clear.
The Quick Morning Check Workflow
A 30-second pre-operating routine that tells you what to expect:
- Open DXRadar solar weather.
- SFI: Is it above 100? If yes, high bands are worth trying. If below 80, plan around 40m and 20m.
- Kp: Is it below 3? If yes, propagation is undisturbed. If above 4, polar paths are degraded — adjust targets accordingly.
- X-ray: Is there an active M or X-class flare? If yes, check the decay on the X-ray chart before operating on low frequencies on the sunlit hemisphere.
- Bz: Is it strongly negative (below −10 nT)? If yes, storm conditions may be arriving or worsening — watch Kp trend.
- Decision: Check best bands now for the automated recommendation based on these values.
Set a browser bookmark to /solar-weather and check it before every HF operating session. The entire dashboard — SFI, Kp, A-index, X-ray, and solar wind — loads on one page. No account required, no app to install. Understanding what you are reading takes five minutes; the actual check takes 30 seconds.
SFI Trends: Rising vs Falling Matters as Much as the Number
A single SFI reading is less useful than knowing the direction of the trend. Because the ionosphere lags solar flux changes by roughly 48 hours, a rising SFI trend means conditions are improving and have not yet fully responded to recent solar output. A falling SFI trend means conditions are degrading but still reflect the recent peak.
Practical rule: rising SFI is bullish, falling SFI is bearish, but neither changes conditions instantly.
The DXRadar solar weather dashboard shows a 27-day SFI chart. If the chart shows a recent upturn, the next 24–48 hours may be better than today's number suggests. If the chart shows a peak three days ago and declining values, conditions are likely declining even if the absolute number looks decent.
Frequently Asked Questions
What is a good SFI for ham radio?
SFI above 100 SFU gives reliable global 20m propagation and opens 15m for DX. At SFI 120, 10m begins to open via F2 on mid-latitude paths. For contest-quality high-band conditions, target SFI 140 or higher. The current live SFI is shown on the DXRadar solar weather page.
What does Kp 5 mean for HF radio?
Kp 5 is a G1 minor geomagnetic storm. High-latitude paths (crossing above approximately 55–60° latitude) will be noticeably degraded — signal levels drop, paths become unstable, and the MUF on polar routes falls. Mid-latitude and equatorial paths are less affected. Kp 5 does not mean all HF is dead; it means you should avoid high-latitude targets and focus on lower-latitude paths.
How long does an HF blackout last after a solar flare?
After an M-class flare, HF below 15 MHz on the sunlit hemisphere is typically affected for 10–60 minutes. After an X1 or larger flare, blackouts can last 1–2 hours or more. Recovery depends on the flare duration and how quickly X-ray flux decays. Monitor the X-ray flux chart in real time to see exactly when flux returns to background levels.
Can I still operate HF during a geomagnetic storm?
Yes. During most G1–G2 storms (Kp 5–6), 40m NVIS for regional contacts within 1,500 km remains reliable. 20m on equatorial paths can still work. Only during G4–G5 events (Kp 8–9) does HF become nearly impossible on most paths — and even then, the situation typically persists for only a few hours before partial recovery. The May 2024 G5 storm temporarily shut down high-latitude paths, but 40m remained functional south of 45°N.
What does a negative Bz mean?
A negative (southward) Bz is the IMF pointing southward, anti-parallel to Earth's magnetic field at the equatorial magnetopause. This alignment allows magnetic reconnection, which transfers energy from the solar wind into the magnetosphere and drives geomagnetic activity. A sustained Bz of −15 nT or lower typically produces a Kp 5–6 response within 30–60 minutes.
For deeper background on individual metrics, read Solar Flux Index Explained and Understanding the K-Index. To understand why these numbers affect the ionosphere, see The Ionosphere Explained.