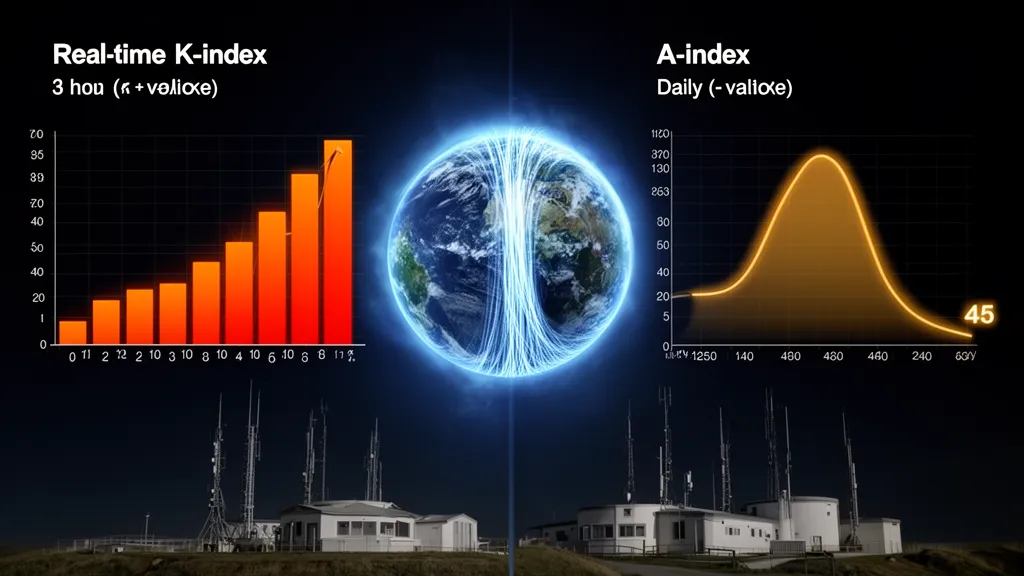
Operator's Verdict: Planetary Kp is 0 and the daily A-index is 3. For real-time geomagnetic storm status and HF impact, see the solar weather dashboard and aurora page.
What the Two Indices Actually Measure
The K-index and A-index both measure geomagnetic disturbance caused by solar wind pressure on Earth's magnetosphere — but they operate on different timescales and different mathematical scales. The K-index is a quasi-logarithmic scale from 0 to 9, updated every 3 hours, measuring the maximum range of variation in the horizontal component of Earth's magnetic field at a magnetometer station. The A-index is a linear daily summary, ranging from 0 to 400, derived mathematically from all eight K values recorded in a 24-hour UT day.
These are not competing measurements. They are complementary tools that answer different questions. Kp tells you what conditions are like right now; the A-index tells you how disturbed the entire day was.
The Kp Index: Real-Time Geomagnetic State
Kp (the planetary K-index) is the globally representative figure most operators actually use. GFZ German Research Centre for Geosciences calculates it every 3 hours from 13 geomagnetically distributed stations worldwide. When DXRadar, DX Summit, or any propagation tool shows a "K-index," it is showing Kp.
The quasi-logarithmic scale matters: each step up is not a fixed nT increase. The field variation corresponding to K=8 is roughly 2.5 times greater than K=7, and K=7 is roughly 2.5 times K=6. This means a jump from Kp 2 to Kp 4 represents a much smaller absolute disturbance than a jump from Kp 6 to Kp 8. Comparing K values arithmetically misleads you.
The A-Index: Daily Storm Scorecard
The A-index linearizes the K-index via a fixed conversion table. Each 3-hour K value is first converted to its equivalent ap (amplitude planetary) value using the lookup table below:
| K-Index | ap Equivalent |
|---|---|
| 0 | 0 nT |
| 1 | 3 nT |
| 2 | 7 nT |
| 3 | 15 nT |
| 4 | 27 nT |
| 5 | 48 nT |
| 6 | 80 nT |
| 7 | 140 nT |
| 8 | 240 nT |
| 9 | 400 nT |
The daily A-index is then the arithmetic mean of the eight ap values from 00:00 to 24:00 UT. Because the K-to-ap conversion is exponential, a single K=8 reading in an otherwise quiet day can push the daily A-index above 30 — a day that was 21 hours quiet but 3 hours severe.
The NOAA Geomagnetic Storm Scale: G-Levels and Their K-Index Equivalents
NOAA's G-scale maps Kp thresholds to operational impact categories (NOAA Space Weather Scales). These are the numbers that drive HF operating decisions:
| NOAA G Scale | Kp Threshold | HF Impact | Approximate A-Index |
|---|---|---|---|
| None | Kp 0–4 | Normal to unsettled | A 0–29 |
| G1 Minor | Kp 5 | High-latitude HF degrades; polar paths unreliable | A ~30–49 |
| G2 Moderate | Kp 6 | Mid-latitude paths affected; widespread high-latitude blackout | A ~50–99 |
| G3 Strong | Kp 7 | HF unreliable at high latitudes; significant mid-latitude degradation | A ~100–149 |
| G4 Severe | Kp 8 | HF largely gone at high latitudes; severe mid-latitude absorption | A ~150–240 |
| G5 Extreme | Kp 9 | Near-total HF blackout at high latitudes; severe global degradation | A ~300–400 |
The A-index figures in that table are approximate — the actual daily A depends on how long the storm sustained each Kp level. A brief Kp 8 spike lasting one 3-hour period will drive a lower A-index than Kp 7 sustained for 24 hours.
Pro Tip: After any G2 or higher storm, the A-index will remain elevated even after Kp drops back to 3–4. An A-index still sitting at 60 while current Kp reads 3 means the ionosphere is recovering — foF2 will be below its quiet-day value. Wait for the A-index to drop below 20 before expecting full band performance.
Why the K-Index (Kp) Is Better for Real-Time Operating
Kp updates every 3 hours. That refresh rate makes it the right tool for deciding whether to try a difficult path right now. A-index cannot tell you that — it only completes at the end of the UT day.
Consider this scenario: at 08:00 UTC, Kp is 6 (G2). By 12:00 UTC, Kp has dropped to 2. The current Kp says conditions are recovering and mid-latitude 15m paths should be opening. But the partial A-index computed through 12:00 UTC is still elevated because it is averaging the G2 reading from earlier. If you rely solely on A-index, you miss the window.
Conversely, if Kp has been hovering at 2 all day but A-index is at 45, it means a storm earlier in the UTC day (which may have been yesterday evening your local time) drove the daily average up. Current Kp of 2 correctly tells you: conditions right now are quiet.
Rule: Use Kp for "should I transmit now." Use A-index for "how was yesterday."
Why the A-Index Is Better for Trend Analysis
The A-index excels at two things Kp cannot do: forecasting ionospheric recovery and comparing days.
Ionospheric scientists and propagation forecasters use the 27-day solar rotation cycle to track recurrent geomagnetic activity. A coronal hole rotating past the Earth's position tends to produce elevated Kp (and therefore elevated A-index) on roughly a 27-day cycle. By tracking daily A-index history over 2–3 solar rotations, you can identify whether a particular period is prone to elevated activity and plan DXpeditions or contest operations accordingly.
ITU-R P.371 specifically identifies the 27-day mean of the daily Ap (the planetary version of A) as the recommended geomagnetic index for long-term ionospheric propagation modeling. Professional propagation prediction tools — VOACAP, ITURHFPROP — use 27-day Ap smoothing rather than instantaneous Kp for their baseline ionospheric models. This is why A-index (specifically the Ap series) is the geomagnetic input for any long-range propagation forecast, while Kp handles real-time status.
Reading the A-Index Scale
| A-Index | Condition | HF Assessment |
|---|---|---|
| 0–7 | Quiet | Excellent — near solar-flux-limited maximum performance |
| 8–15 | Unsettled | Minor degradation on high-latitude paths |
| 16–29 | Active | Noticeable degradation on polar circuits; 10m/15m paths to polar regions affected |
| 30–49 | Minor storm | Significant HF degradation above 50° latitude; Kp likely reached 5 during the day |
| 50–99 | Major storm | Widespread HF impairment; Kp likely reached 6–7; 24–48 hour recovery expected |
| 100–400 | Severe/Extreme | HF largely collapsed at high latitudes; multiple days to full recovery |
How Both Indices Affect HF Bands in Practice
A G2 day (Kp peaking at 6, daily A-index around 60) affects HF bands in a consistent, predictable pattern. Understanding which bands go first lets you adapt rather than just wait out the storm.
10m (28 MHz) and 12m (24 MHz): These disappear first on polar-crossing paths — North America to Europe, North America to Japan via the Arctic. F2 irregularities and enhanced D-layer absorption combine to shut down these paths within an hour of Kp reaching 5–6. TEP paths to South America and equatorial Africa can survive at these frequencies because equatorial ionization is less disturbed.
15m (21 MHz) and 17m (18 MHz): Follow 10m down within a few hours of G2 onset on polar paths. Mid-latitude east-west paths often survive Kp 6.
20m (14 MHz): The "workhorse" band is more resilient but not immune. North-pole-crossing paths from North America to Europe close at Kp 6–7. Long-path routes (going east from North America, crossing the Pacific toward Europe) often remain open a few hours longer.
40m (7 MHz): NVIS at mid-latitudes survives all but the most extreme G4–G5 events for operators below 50° N. Polar and trans-polar paths on 40m close earlier. Night-side 40m DX can actually improve during moderate storms at some latitudes due to enhanced nighttime F-layer ionization — a well-documented but geographically variable phenomenon.
For live band assessments reflecting current Kp, check DXRadar's solar weather page and the aurora dashboard.
Frequently Asked Questions
What is the difference between A-index and K-index for ham radio?
The K-index (and Kp, the planetary average) measures geomagnetic activity over a 3-hour interval on a quasi-logarithmic 0–9 scale, updated every 3 hours. The A-index is a linear daily summary (0–400) calculated from all eight K readings in a 24-hour UT day. Kp drives real-time operating decisions; the A-index is best for day-after storm assessment and multi-day trend analysis.
What A-index is good for ham radio propagation?
An A-index below 20 indicates quiet conditions — propagation is near its solar-flux-limited maximum. A 20–50 is unsettled, with noticeable degradation on high-latitude circuits. Above 50 marks a stormy day with significant HF impairment on long-haul polar paths. For optimal DX conditions, look for A below 10 combined with SFI above 120.
How is the A-index calculated from the K-index?
Each of the eight daily K readings is converted to an ap equivalent via a fixed lookup table (K=5 → ap=48, K=8 → ap=240, etc.). The daily A-index is the arithmetic mean of those eight ap values. A single K=9 reading (ap=400) in an otherwise K=1 day produces a daily A of about 56 — stormy by daily standards, despite being a mostly quiet day.
Is Kp the same as K-index?
The distinction matters. A local K-index comes from one magnetometer station; Kp (planetary) is a weighted global average from 13 stations, calculated by GFZ every 3 hours. At high latitudes (Alaska, Iceland, Norway above 60° N), local K can run 2–3 points above Kp during storm onset. Operators at those QTHs may experience G4-equivalent conditions while Kp reads 6. DXRadar displays Kp.
What Kp level causes a geomagnetic storm?
NOAA defines G1 (Minor) at Kp 5, G2 (Moderate) at Kp 6, G3 (Strong) at Kp 7, G4 (Severe) at Kp 8, and G5 (Extreme) at Kp 9. Storm onset at Kp 5 primarily degrades high-latitude and polar-crossing HF paths. By Kp 7, mid-latitude paths suffer meaningfully. Kp 9 produces near-total HF blackout at high latitudes.
How long does it take for the A-index to recover after a storm?
After a major storm (A-index above 50), the ionosphere typically needs 24–48 hours to return to quiet behavior. The A-index dropping below 20 the following day is a practical recovery indicator. The F2 layer's foF2 may remain slightly below quiet-day values for another day after the A-index normalizes, particularly at high latitudes.
Content reviewed by DXRadar team. Data sources: NOAA SWPC, GFZ German Research Centre for Geosciences, ITU-R.
For live geomagnetic data and HF impact assessment, see the DXRadar solar weather dashboard. For related reading, see Understanding the K-Index and Kp and What Is SFI?.