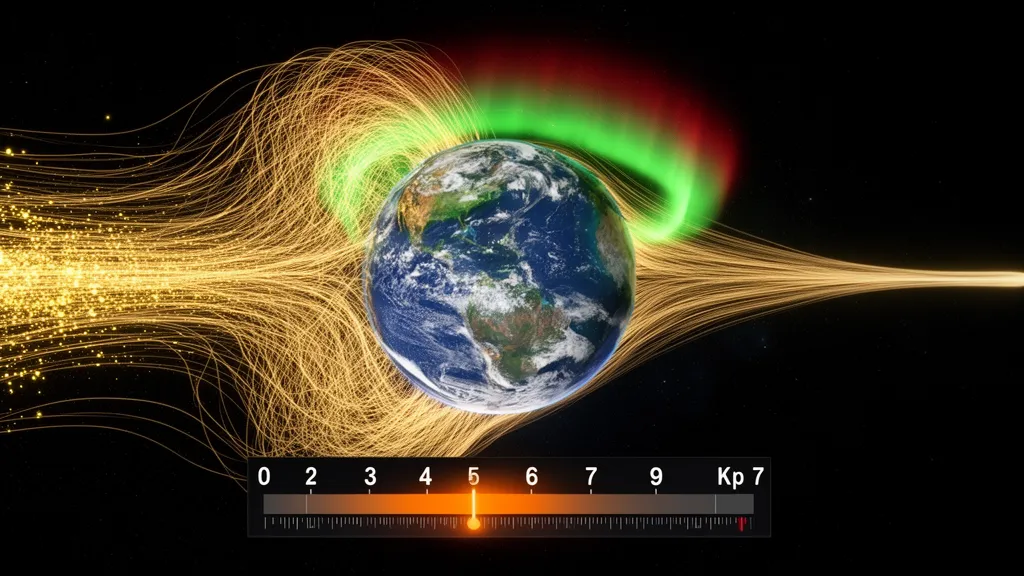
Operator's Verdict: The planetary K-index is 0.33 and the Solar Flux Index is 104 SFU. High-latitude paths are normal. Check the aurora dashboard for the current geomagnetic storm level and HF impact assessment.
What the K-Index and Kp Actually Measure
The K-index is a quasi-logarithmic scale from 0 to 9 that measures horizontal geomagnetic field variation at a magnetometer station over a 3-hour interval. A K-index of 0 means an extremely quiet field; K 9 is the most severe geomagnetic storm on record. The planetary index, Kp, is a weighted global average derived from readings at 13 geomagnetically distributed stations worldwide, published every 3 hours by the GFZ German Research Centre for Geosciences — the official Kp data center (GFZ Kp Index).
The measurement works like this: each station's magnetometer records the horizontal component of Earth's magnetic field continuously. At the end of each 3-hour interval (00:00–03:00, 03:00–06:00 UTC, etc.), the maximum range of variation during that interval is converted to a K-value on that station's local scale, then all 13 stations' values are combined into the planetary Kp. The quasi-logarithmic conversion means that each step up in K-index represents a larger absolute field disturbance than the previous step — the difference between K 7 and K 8 is roughly 2.5 times the field variation of the difference between K 3 and K 4.
When propagation tools and news reports refer to "the K-index," they almost always mean Kp — the global figure — not a local station K. DXRadar displays Kp.
The NOAA Geomagnetic Storm Scale: G1 Through G5
NOAA's Space Weather Scale maps Kp values to a G1–G5 severity ranking, each with defined radio and power-grid impacts (NOAA Space Weather Scales). These are the thresholds that matter for HF operators:
| NOAA Scale | Kp Threshold | Classification | Typical HF Impact |
|---|---|---|---|
| G1 | Kp 5 | Minor storm | High-latitude HF unreliable; polar paths degrade; aurora possible at geomagnetic lat. 60° |
| G2 | Kp 6 | Moderate storm | HF degrades at high latitudes; mid-latitude paths affected on north-south circuits; aurora to ~55° |
| G3 | Kp 7 | Strong storm | HF unreliable at high latitudes; widespread degradation on long-haul paths; aurora to ~50° |
| G4 | Kp 8 | Severe storm | HF propagation largely lost at high latitudes; significant mid-latitude absorption; aurora to ~45° |
| G5 | Kp 9 | Extreme storm | HF blackout at high latitudes; severe degradation globally; aurora visible at low latitudes |
Each G-level storm occurs with decreasing frequency: G1 events happen a few times per solar cycle peak year; G5 events occur perhaps once per solar cycle. The May 10–11, 2024 G5 storm — reaching Kp 9.33 — was the most intense since the Halloween storms of October 2003 (NOAA SWPC Storm Report, May 2024).
During that G5 event, 20m went completely silent on high-latitude paths from North America to Scandinavia and Japan via the polar route. Operators south of 45° N held 40m NVIS contacts out to approximately 500 km throughout the night. Meanwhile, 6m aurora scatter opened dramatic DX paths across Europe. The storm simultaneously killed the most-used DX bands and opened rare VHF propagation modes — a pattern worth understanding and planning for.
How Geomagnetic Storms Damage HF Propagation
The mechanism connecting Kp to HF propagation is D-layer absorption and ionospheric irregularities — two different but related effects. Understanding the distinction helps you predict which bands will be affected and which will survive.
D-layer absorption (the primary culprit): During geomagnetic storms, energetic particles from the solar wind penetrate the polar ionosphere and dramatically enhance ionization in the D-layer (the lowest ionospheric layer, at approximately 60–90 km altitude). The D-layer absorbs radio waves — particularly at lower HF frequencies — rather than reflecting them. On quiet days, the D-layer is only significant during daylight hours. During a geomagnetic storm, an enhanced D-layer over the polar regions can persist through the night, blocking paths that cross those regions at any time.
Ionospheric irregularities: High Kp values also create plasma turbulence in the F2 layer, causing signal scintillation, rapid fading, and unpredictable foF2 variations. Even signals that penetrate the D-layer may arrive with extreme multipath fading and signal instability.
The latitude factor is critical: Operators above approximately 50° N geomagnetic latitude feel these effects most severely. For a station in Scandinavia, Iceland, or Alaska, a G2 storm (Kp 6) may produce the same path blackout that a G4 storm (Kp 8) causes for an operator in the southeastern United States. Mid-latitude operators (30°–50° N) typically remain workable through G2 and into G3, while equatorial stations (below 20°) are largely unaffected by all but the most extreme G5 events.
Pro Tip: The DXRadar Aurora Dashboard shows the live Bz component of the interplanetary magnetic field (IMF), solar wind speed, and the hemispheric power index — the combination that determines whether a geomagnetic storm is developing. When Bz swings south of −10 nT and the solar wind speed exceeds 500 km/s, watch for Kp to rise within 30–60 minutes. This gives you a narrow window to work last-minute DX before high-latitude paths close.
The Silver Lining: Aurora Scatter on 6m and 2m
Kp 5 and higher reliably opens aurora scatter propagation on 6m (50 MHz) and 2m (144 MHz) — the same geomagnetic disturbance that kills HF creates a reflective plasma curtain in the polar ionosphere. This is one of the most interesting propagation reversals in amateur radio: your HF rig goes quiet as your VHF equipment suddenly comes to life.
Aurora scatter on 6m typically requires Kp 5 or higher to be detectable at mid-latitudes. On 2m, Kp 6 or higher is usually needed for workable contacts. Signals reflected off the aurora have a characteristic distorted sound — heavily frequency-spread, almost like white noise with modulation — caused by the turbulent plasma curtain scattering signals across a wide frequency range. CW and weak-signal digital modes (particularly FT8 and MSK144) work far better than SSB for aurora contacts because they tolerate the Doppler spreading and poor signal quality.
The geometry of aurora scatter favors east-west paths at high latitudes. A station in England during a G2 storm (Kp 6) can work stations in Scandinavia easily on 6m aurora scatter. Contacts from the UK to North America via aurora are possible during G3+ events when the aurora oval expands significantly equatorward.
For live aurora visibility and HF impact data, the DXRadar Aurora page integrates the NOAA OVATION aurora model with the real-time Bz and Kp feed.
The A-Index: The Cumulative Damage Scorecard
The A-index is a daily linear measure of geomagnetic activity, derived mathematically from all eight 3-hour K-index readings in a 24-hour UT day. It ranges from 0 to 400. Here is the interpretation scale:
| A-Index Range | Activity Level | HF Assessment |
|---|---|---|
| 0–7 | Quiet | Excellent propagation conditions |
| 8–15 | Unsettled | Minor degradation on high-latitude paths |
| 16–29 | Active | Noticeable HF degradation on polar circuits |
| 30–49 | Minor storm | Significant HF degradation, particularly above 50° N |
| 50–99 | Major storm | Widespread HF blackout on long-haul paths |
| 100–400 | Severe/Extreme | HF propagation largely collapsed at high latitudes |
Because the A-index averages an entire day's worth of K-index readings into a single number, it is better for retrospective assessment than real-time operating decisions. If yesterday's A-index was 60, you know a major storm passed. But to know what conditions are right now at 14:30 UTC, you need the current Kp — which has been updated within the past 3 hours.
When to use each:
- Kp: Real-time operating decisions. "Should I try this north-pole-crossing path to JA right now?"
- A-index: Day-after assessment and longer-range planning. "Did conditions recover from yesterday's storm? Is the ionosphere still disturbed?"
A useful rule of thumb: after a major storm (A-index above 50), allow 24–48 hours for the ionosphere to return to quiet-day behavior. The A-index dropping below 20 the following day is a reliable indicator that conditions have normalized.
The K-Index on Different Bands: Who Gets Hurt First?
Geomagnetic storms do not affect all bands equally or simultaneously. Here is the practical band-by-band impact for a typical G2 storm (Kp 6) at a mid-latitude QTH (approximately 45° N):
10m (28 MHz) and 15m (21 MHz): These high bands rely on F2 layer integrity for DX propagation. Storm-induced irregularities cause rapid QSB (fading) and unpredictable signal levels. On paths routing over polar regions — North America to Europe, North America to Japan via the Arctic — 10m and 15m close first and hardest. However, trans-equatorial propagation (TEP) on 10m and 15m can survive moderate storms because it relies on equatorial F-region ionization, which is less affected by polar geomagnetic disturbances.
20m (14 MHz): The "all-weather band" is more resilient than the high bands but not immune. North-pole-crossing paths from North America to Europe degrade by G2. East-west paths and equatorial paths hold longer. During G1 storms (Kp 5), experienced 20m operators shift to paths that avoid the disturbed polar ionosphere — for example, routing DX to Europe via long-path (going east over the Pacific) rather than short-path over the North Pole.
40m (7 MHz) and 80m (3.5 MHz): NVIS (Near Vertical Incidence Skywave — a propagation mode where signals are sent nearly straight up and return within a few hundred km) is the most storm-resistant HF mode. These bands, operated NVIS, bounce off the relatively undisturbed lower F-layer and mid-latitude ionosphere. During the May 2024 G5 storm, 40m NVIS contacts within approximately 500 km remained workable for operators below 45° N throughout the storm. The D-layer absorption on 40m during a severe storm increases noise levels and reduces signal strength, but NVIS contacts typically survive into G4 territory for equatorial and sub-tropical operators.
The low-band paradox: 40m and 80m can actually benefit from geomagnetic storms at night on certain paths. When the storm's enhanced ionization creates a more reflective nighttime F-layer at mid-latitudes, skywave propagation on 40m can improve for regional paths even as high-latitude paths collapse. This is not universal, but experienced 40m operators have reported unusually strong signals on some mid-latitude paths during moderate G2 storms.
Check 40m band conditions and 10m band conditions for live propagation assessments filtered by current Kp.
Local K vs. Planetary Kp: When the Distinction Matters
For most operators at most latitudes, Kp is the right number to monitor. But there are situations where knowing your local K-index — from the nearest magnetometer station — provides better prediction of your specific path conditions.
If you are in Alaska, Iceland, northern Scandinavia, or Canada above 55° N, the Kp figure can significantly underestimate the geomagnetic disturbance at your location. These high-latitude stations routinely see local K-indices two to three points above the global Kp average during storm events. An operator in Tromsø, Norway (geomagnetic latitude approximately 66° N) may be experiencing K 8 locally while Kp is reported at 6. Their HF experience will match a G4 storm, not a G2.
Conversely, at equatorial latitudes (below 20° N or S), local K-index readings are often lower than Kp during moderate storms. The geomagnetic equatorial region has its own ionospheric dynamics — the equatorial electrojet and equatorial fountain effect — that respond differently to solar wind pressure than mid-latitude regions.
The DXRadar Solar Weather page displays global Kp. For your local K-index, cross-reference with the nearest INTERMAGNET station for your region.
Operational Strategy: Working Around the K-Index
Experienced DX chasers adapt their operating strategy to the Kp level rather than simply waiting for it to drop. Here is a practical framework:
Kp 0–2 (Quiet): Maximum propagation. Prioritize 10m, 12m, and 15m if SFI supports it. Contest stations schedule major operating for these windows. Long-path paths to the Pacific and Indian Ocean regions are fully reliable.
Kp 3–4 (Unsettled): Shift high-band paths away from polar routing. For North American operators, Europe via long-path (going east, crossing the Pacific) becomes viable on 20m and 15m. Focus 10m activity on TEP paths to South America, the Caribbean, and equatorial Africa rather than high-latitude circuits. Signal strengths are typically within 1–2 S-units of quiet-day values on surviving paths.
Kp 5–6 (G1–G2 Storm): High-latitude paths are unreliable. Operate 40m and 20m on mid-latitude and equatorial paths. If you are at a VHF-capable station (6m or 2m), monitor for aurora scatter opportunities — this is when the VHF aurora opens. Check the aurora dashboard for real-time oval position.
Kp 7+ (G3 and above): Accept that HF DX is difficult. Use the opportunity to work 40m NVIS for regional contacts, monitor for VHF aurora scatter, or catch up on antenna maintenance. After G3 storms, conditions often rebound strongly 24–48 hours later as the ionosphere recovers — the so-called "storm after-effect," which can produce above-average foF2 values and unexpected band openings.
Frequently Asked Questions
What does K-index 5 mean for ham radio?
A K-index of 5 (Kp 5) marks the threshold for a G1 (Minor) geomagnetic storm (NOAA Space Weather Scales). It typically degrades HF propagation on high-latitude paths crossing above approximately 50° N or 50° S, can cause polar path blackouts, and expands the aurora oval equatorward to approximately geomagnetic latitude 60°. Mid-latitude operators on 40m and 20m may notice degradation on north-south circuits. The current Kp is 0.33. Check the solar weather dashboard for the live storm level.
What is the difference between K-index and Kp?
The K-index is a local measurement from a single magnetometer station, covering a 3-hour interval on that station's calibrated scale. Kp (the planetary K-index) is a global average derived from 13 geomagnetically distributed stations worldwide, calculated and published every 3 hours by the GFZ German Research Centre for Geosciences. When propagation tools display a single "K-index" value, they are showing Kp. Your local K may differ from Kp by 1–3 points, particularly at high latitudes during storm events.
What K-index is good for HF propagation?
Kp 0–2 is the optimal range for HF propagation — quiet conditions with maximum path reliability, minimum polar absorption, and the highest foF2 values consistent with the current SFI. At Kp 3, minor degradation begins on high-latitude circuits. Kp 5 (G1 threshold) degrades polar paths reliably. For DX planning, aim for days when both Kp is below 3 and SFI is above 120 for the best chance at long-haul high-band contacts.
How does the K-index affect 40 meters?
At Kp 0–4, 40m operates normally — NVIS within 1,500 km by day, worldwide nighttime F-layer propagation. At Kp 5–6, polar-crossing 40m paths degrade. At Kp 7 and above, even mid-latitude 40m paths suffer increased absorption, but NVIS contacts within 500–1,000 km remain workable for operators away from the auroral zone. The 40m band is the most storm-resilient HF DX band for mid-latitude operators. Check current 40m conditions for live status.
What is the A-index in ham radio?
The A-index is a daily linear measure of geomagnetic activity (0–400), derived from the eight 3-hour K-index readings in a 24-hour UT day. A below 20 indicates quiet conditions; A 20–50 is unsettled; A above 50 indicates a stormy day. Use Kp for real-time operating decisions (updated every 3 hours) and the A-index for day-after assessment of whether a storm has passed. After a major storm (A above 50), allow 24–48 hours for full ionospheric recovery.
For related propagation context, see Understanding the Solar Flux Index (SFI) — the companion metric that measures solar ionizing output. For complete propagation category articles, visit the DXRadar propagation blog.