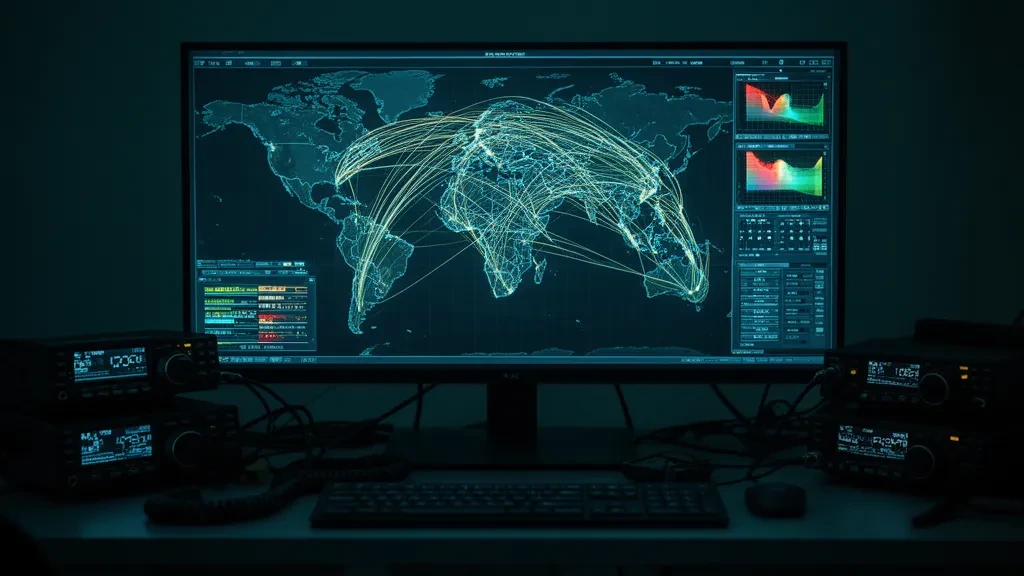
Operator’s Verdict: There is no single “best” DX map — there are different data sources wearing maps. DXMaps remains the VHF/6m Es reference; DXHeat is the cleanest cluster client; PSKReporter is the raw truth for digital modes; DXLook and DXRadar are the modern mobile-first options. Pick by what question you’re asking, not by habit. The comparison below is by documented capability — no scores, no pretend benchmarks.
What You’re Actually Choosing: a Data Source
Every “live DX map” is a visualization of one or more feeds, and the feed decides what you see:
- DX-Cluster spots — humans (and skimmers) announcing stations. Rich for contests and DXpeditions, biased toward what people bother to spot.
- PSKReporter reception reports — automated digital-mode decodes, overwhelmingly FT8. Superb propagation evidence, silent about SSB/CW activity.
- RBN (Reverse Beacon Network) — CW skimmer decodes. The CW picture.
- Propagation models (VOACAP) — what should propagate, no observation at all.
A band can be wide open and show nothing on a cluster map because nobody called CQ. Keep that in mind for every tool below.
The Field, Compared
| Tool | Data source | Strongest at | Mobile | Embeddable |
|---|---|---|---|---|
| DXMaps (EA6VQ) | Cluster + PSKReporter | VHF/6m Es visualization by band | Desktop-dense | ⛔ terms forbid reuse |
| DXHeat | DX-Cluster | Fast, filterable cluster client | Usable | No |
| HamDXMap (F5UII) | Cluster + MUF overlays | Cluster map + SDR directory | PWA | No |
| DXLook | PSK + RBN + WSPR + APRS | Multi-source overlays | Mobile-first | No |
| PSKReporter | Its own network | Raw digital-mode truth | Functional | No |
| VOACAP Online | Prediction model | Point-to-point forecasts | Desktop | No |
| DXRadar | PSKReporter + NOAA solar telemetry | Spots fused with the why (SFI/Kp/X-ray), band conditions, per-grid answers | Installable PWA | ✅ free widget |
Where Each One Wins
DXMaps is the incumbent for a reason: its per-band VHF maps during a 6m Sporadic-E opening are still the reference picture, and serious Es chasers keep it open all summer. Its limits are a desktop-era interface and strict terms — you may not reuse its maps on your own site. If your interest is specifically 6m Es, also see our live Sporadic-E map, which fuses the 6m spot picture with MUF estimates.
DXHeat is the cluster client to beat: fast filtering by band, mode, and continent with a clean interface. It maps spots; it does not try to explain propagation.
HamDXMap layers cluster spots with MUF contours and carries an unmatched directory of web-received SDRs — useful when you want to listen to a distant band, not just see it.
DXLook is the most ambitious of the newer tools: PSK, RBN, WSPR, and APRS in one modern map. We compare it with DXRadar in detail here.
PSKReporter is where much of everyone else’s digital data comes from. When you want the unfiltered answer to “who is hearing me,” go to the source — our PSKReporter comparison covers when the raw view beats any dashboard.
VOACAP Online is not a spot map at all — it predicts. Use it for planning a path hours ahead; use observation maps for what’s happening now. Background: how VOACAP works.
DXRadar — ours, so judge accordingly — is built around one idea: put the observed spots and the cause (live SFI, K-index, X-ray flux) on the same screen, answer “what’s open from my grid” with per-grid condition pages, and make it work as an installable app in the field. The live dashboard is free, and it’s the only tool in this list with a free embeddable widget for club sites — DXMaps forbids that use, and nobody else offers it.
Which One Should You Use?
- Chasing 6m Es this summer → DXMaps and/or DXRadar’s Sporadic-E map, plus alerts.
- Contest weekend cluster watching → DXHeat.
- “Is my signal getting out on FT8?” → PSKReporter directly.
- Planning a path for a sked tomorrow → VOACAP.
- One screen for conditions + spots + why, on any device → DXRadar’s dashboard, which also runs as a fullscreen shack display.
- Live band conditions on your club’s website → the embed widget — the one job none of the classic maps will do for you.
Frequently Asked Questions
What is the best alternative to DXMaps?
It depends on what you use DXMaps for. For VHF/6m Sporadic-E watching, DXMaps itself is still the reference. For a filterable DX-cluster map, DXHeat and HamDXMap are strong. For raw digital-mode reception data, go straight to PSKReporter. For a mobile-friendly live map fused with solar weather and band conditions, that’s what DXRadar’s dashboard does.
Why do DX maps show different spots than what I hear?
Every DX map shows its own data source, not “the truth.” Cluster-based maps (DXMaps, DXHeat) show what operators chose to spot; PSKReporter-based maps show automated digital-mode reception reports, weighted heavily toward FT8; RBN shows CW skimmer decodes. A path can be open and appear on none of them if nobody transmitted on it.
Can I embed a DX map on my club website?
Not from DXMaps — its terms explicitly forbid using its maps or lists in your own web pages. If you want live band conditions on a club site, use an embeddable widget built for that purpose; DXRadar offers a free one with script, iframe, and image-banner formats.
Is there a DX map that works well on a phone?
Most classic DX maps are desktop-dense designs. DXLook and DXRadar are the mobile-first options — DXRadar is an installable PWA, so the live map and band conditions work as an app on a phone in the field.