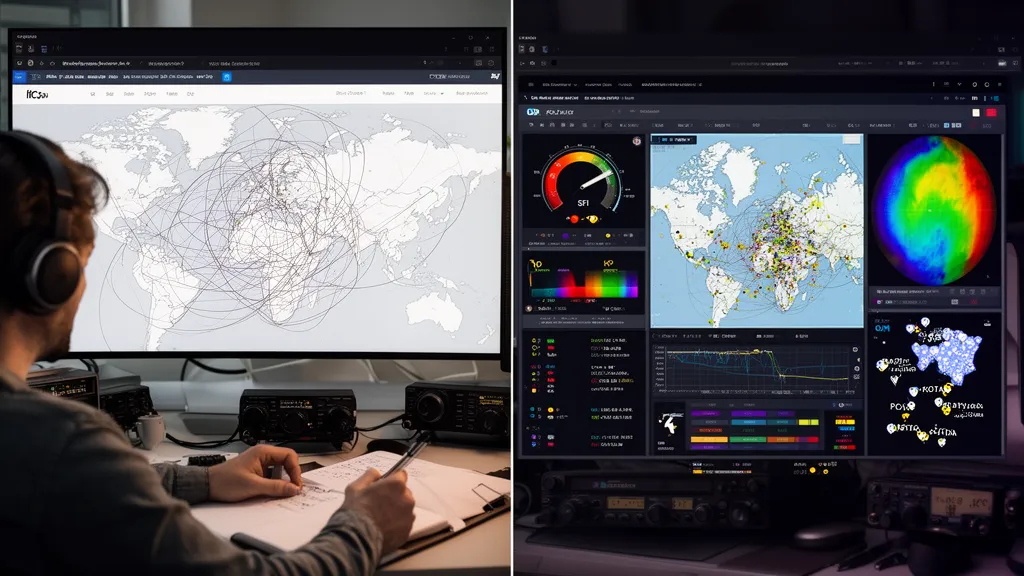
Operator’s Verdict: DXLook specialises in clean DX cluster spot maps. DXRadar offers DX cluster maps plus solar weather, aurora dashboard, PSKReporter propagation, POTA activators, and 3D globe. Use DXLook when you only need a DX spot map; use DXRadar when you want the full operating context.
Two Different Scopes
DXLook.eu and DXRadar share a common feature — both show DX cluster spots on a map — but they’ve developed in different directions from that shared starting point.
DXLook has refined and focused its DX spot map to a high level of quality within a focused scope. It does one thing and does it well.
DXRadar has built a broader operating environment around the same DX spot data, adding solar weather, digital mode propagation, aurora, and POTA features.
This is a case where scope, not quality, determines which tool fits better.
Pro Tip: Check DXRadar’s best bands now and your band-specific pages before heading out — live propagation data beats any static forecast.
DX Cluster Data: Broadly Similar
The DX cluster network is a mesh of servers worldwide that relay manually-submitted spots between nodes. Both DXLook and DXRadar connect to this network and display the resulting spot data on maps.
For the core use case — “where is DX activity right now?” — the two tools provide broadly equivalent information drawn from the same source. The cluster data is the cluster data.
Where they diverge is in what else they show alongside the cluster data.
Feature Comparison
| Feature | DXLook | DXRadar |
|---|---|---|
| DX cluster spots on map | ✅ | ✅ |
| Band filtering | ✅ | ✅ |
| PSKReporter digital mode spots | ❌ | ✅ |
| Solar weather (SFI, Kp) | ❌ | ✅ |
| Aurora dashboard | ❌ | ✅ |
| 3D space weather globe | ❌ | ✅ |
| POTA activator map | ❌ | ✅ |
| Band-specific pages | ❌ | ✅ (/band/[band]) |
| X-ray flux history | ❌ | ✅ |
| Solar imagery (SDO) | ❌ | ✅ |
| Mobile-responsive | ✅ | ✅ |
When DXLook Has an Advantage
DXLook’s focused scope produces a cleaner DX spot map interface for users who specifically want to see cluster spots without additional data layers competing for screen space. If you find the solar weather context distracting and just want to see what rare DX is being worked right now, DXLook’s single-purpose interface may suit you better.
Who Benefits From DXRadar’s Broader Scope
The integrated view matters when your radio decisions depend on multiple factors simultaneously:
“Is 15m to Japan open, and if the spots disappear, is it because the band closed (check propagation map) or because a flare killed HF (check X-ray data) or because a storm started (check Kp)?”
DXRadar lets you answer all three sub-questions without switching tools. This integration accelerates operating decisions during contest weekends, DXpedition chasing, or POTA activations when conditions matter.
For operators focused on specific rare DX chasing (chasing DXCC entities), DXLook’s focused DX spot map may be the primary tool, with DXRadar as a supplementary resource for propagation context when needed.
Frequently Asked Questions
What is DXLook?
DXLook.eu is a European-developed web service that displays DX cluster spots on a geographic map. Operators can filter by band, see recent spots on a world map, and view which stations are being worked from which locations. It pulls data from the DX cluster telnet network and presents it as a geographic map interface. DXLook is primarily focused on the DX cluster spot visualisation function and is well-regarded for its clean map display and band filtering.
How is DXRadar different from DXLook?
DXRadar integrates DX cluster spot mapping alongside solar weather data, PSKReporter digital mode propagation, POTA activator maps, aurora dashboard, and space weather globe. DXLook focuses specifically on DX cluster spot visualisation. The practical difference: DXLook is a DX spotting map; DXRadar is a complete radio propagation and operating environment. If you only want to see DX cluster spots on a map, DXLook does that well. If you want propagation context (why is 15m behaving this way?), aurora information, POTA activators, and digital mode propagation alongside DX spots, DXRadar provides the integrated view.
Does DXRadar show the same spots as DXLook?
Both tools draw from the DX cluster network, but they may use different cluster nodes, filters, and aggregation methods, resulting in slightly different spot sets at any given moment. Additionally, DXRadar overlays PSKReporter digital mode reception data, which DXLook does not. DX cluster spot coverage from the two services is broadly comparable for standard HF DX contacts. Timing differences are usually seconds to a minute. For following a specific rare DX station actively spotted on the cluster, either tool will capture most spots.
Which tool is better for VHF and 6m operators?
DXRadar has more relevant features for VHF and 6m operators: the 6m band-specific page (/band/6m) integrating sporadic-E indicators, solar flux for F2, and propagation map; the aurora dashboard showing VHF aurora conditions; and the full propagation map including 50 MHz and 144 MHz spots from PSKReporter. DXLook’s core use case is HF DX cluster spots, which is less directly relevant for VHF propagation planning. For VHF operators specifically, DXRadar’s VHF-relevant tools make it the better choice.
Is there a mobile app for DXRadar or DXLook?
Neither DXRadar nor DXLook currently offers a dedicated native mobile app (iOS/Android). Both are web applications accessible via mobile browsers. DXRadar is designed to be mobile-responsive — its key pages (solar weather, best-bands-now, propagation map) render appropriately on smartphone screen sizes. For in-field use during POTA activations or portable operations, DXRadar’s mobile-optimised pages are directly accessible via browser bookmark.