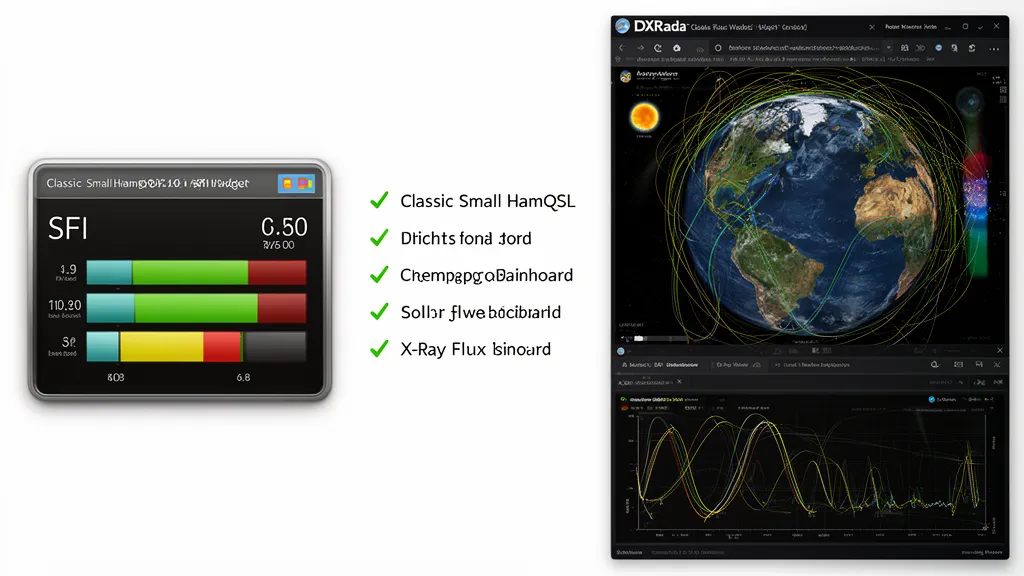
Operator’s Verdict: HamQSL widget = embeddable status badge for websites, quick SFI/Kp glance. DXRadar = full propagation dashboard for active radio planning. Most operators use both: the widget on their club site, DXRadar for actual session planning.
The HamQSL Widget: What It Does Well
The HamQSL solar widget by N0NBH has been the de facto solar status indicator for amateur radio websites since the mid-2000s. It solves a specific, clear problem: how do you display current solar conditions on a club website without requiring members to navigate to a separate page?
The widget format — a compact graphic panel showing SFI, SSN, A-index, K-index, and qualitative band condition indicators — became an amateur radio community standard. Thousands of club websites display it in their sidebars.
What the widget shows well:
- SFI (current solar flux, updated from NOAA)
- SSN (sunspot number)
- K-index and A-index
- Qualitative band conditions (Good/Fair/Poor for broad frequency ranges)
- Compact embeddable format (fits in a website sidebar without disrupting layout)
Pro Tip: Check DXRadar’s best bands now and your band-specific pages before heading out — live propagation data beats any static forecast.
Where the Widget Falls Short
The HamQSL widget’s compact design necessarily limits what it can show:
No propagation maps: The widget shows solar indices but not actual DX spot data. You can see that SFI is 150 (good conditions) but not that the 15m band to Europe is currently dead while 20m is packed with transatlantic contacts.
Qualitative band ratings are approximate: The Good/Fair/Poor band ratings are computed from SFI and K-index using simple thresholds. They don’t account for:
- Time of day (40m behaves very differently at noon vs. midnight)
- Geographic path specifics (transequatorial 10m vs. polar 10m)
- Sporadic-E (which makes 10m/6m conditions Good even when SFI says Poor)
No historical trend: The widget shows current values without trend context. Is Kp rising or falling? Has SFI been dropping for days? The widget doesn’t tell you.
DXRadar’s Approach
DXRadar was designed for radio operators who want actionable information, not a static summary widget. The design philosophy differs:
| Aspect | HamQSL Widget | DXRadar |
|---|---|---|
| Form factor | Embeddable image | Web application |
| Data depth | Summary indices | Full propagation data |
| Propagation map | No | Yes (live spots) |
| DX cluster | No | Yes |
| Aurora data | No | Yes (full dashboard) |
| POTA activators | No | Yes |
| Solar wind | No | Yes |
| Mobile app | No | Mobile-responsive site |
| Update frequency | Every 5 minutes | Multiple sources, rolling |
Using Both Together
The most practical approach for an active radio operator:
HamQSL widget → embed on your club website or personal radio page as a quick-reference status indicator for visitors
DXRadar → use as your personal operating dashboard before and during radio sessions
These complement each other without redundancy. The widget tells visitors “is today generally a good radio day?” DXRadar tells you “what band is open right now, is there a storm brewing, and who is active on POTA?”
Quick Reference: Which to Use When
| Question | Use |
|---|---|
| ”What’s SFI today?” for a quick glance | HamQSL widget |
| ”Which band is open between me and Japan right now?” | DXRadar propagation map |
| ”Is there a geomagnetic storm affecting polar paths?” | DXRadar solar weather |
| ”What should I put on my club website?” | HamQSL widget (embeds cleanly) |
| “Should I switch bands mid-contest?” | DXRadar best-bands-now |
| ”What X-ray activity has there been in the last 6 hours?” | DXRadar solar weather |
Frequently Asked Questions
What is the HamQSL solar widget?
The HamQSL solar widget is a free embeddable graphic created by Paul Herrman (N0NBH) that displays current solar indices on a small panel suitable for embedding in amateur radio club websites and personal pages. The widget shows SFI (Solar Flux Index), SSN (Sunspot Number), A and K indices, signal bands (shown as Good/Fair/Poor for various HF paths), and X-ray flux level. It has been widely used in the amateur radio community for over 15 years and is the most recognised solar condition indicator on ham radio websites. The widget pulls data from NOAA SWPC and updates every few minutes.
How is DXRadar different from the HamQSL widget?
The HamQSL widget is a compact, embeddable status indicator showing summary solar indices. DXRadar is a full propagation dashboard providing live propagation maps, real-time DX spot tracking, aurora visualisation, 3D space weather globe, band-specific condition pages, POTA activator maps, and historical data. The widget gives you a quick glance at SFI and Kp. DXRadar gives you a complete radio operating environment with propagation maps, solar weather context, and DX activity. Most radio operators use the HamQSL widget for quick reference on club websites and DXRadar for serious pre-session planning.
Can I embed DXRadar data on my website?
DXRadar is designed as a full web application rather than an embeddable widget. For embedding solar data on your website or club page, the HamQSL widget remains the most practical choice. For linking to comprehensive propagation data, linking to DXRadar pages (/solar-weather, /best-bands-now) is appropriate. The HamQSL widget serves the ‘quick status badge on a website’ use case that DXRadar doesn’t target.
What do the band condition indicators on the HamQSL widget mean?
The HamQSL widget shows predicted band conditions as Good/Fair/Poor for categories like ‘80m-40m’, ‘30m-15m’, ‘10m-6m’ and for specific path types (HF Low, HF High, 6m). These are algorithmically derived from the current SFI, A-index, and K-index using simple heuristics. They represent a rough guide rather than precise propagation predictions. Good means conditions are supportive of propagation on those bands; Poor means ionospheric conditions are unfavorable. They don’t account for specific geographic paths, time of day, or sporadic-E — which is why DXRadar’s live spot data provides more accurate current conditions.
Which tool should I bookmark for daily radio use?
For daily radio planning, bookmark DXRadar’s solar weather page (/solar-weather) rather than the HamQSL widget. DXRadar’s page shows the same solar indices (SFI, Kp, A-index) plus live propagation maps, aurora data, solar wind, and X-ray flux in a format designed for operating decisions. The HamQSL widget is excellent for displaying on a club website where members want a quick reference view without leaving the page. For your own active use, a full dashboard provides more actionable information.