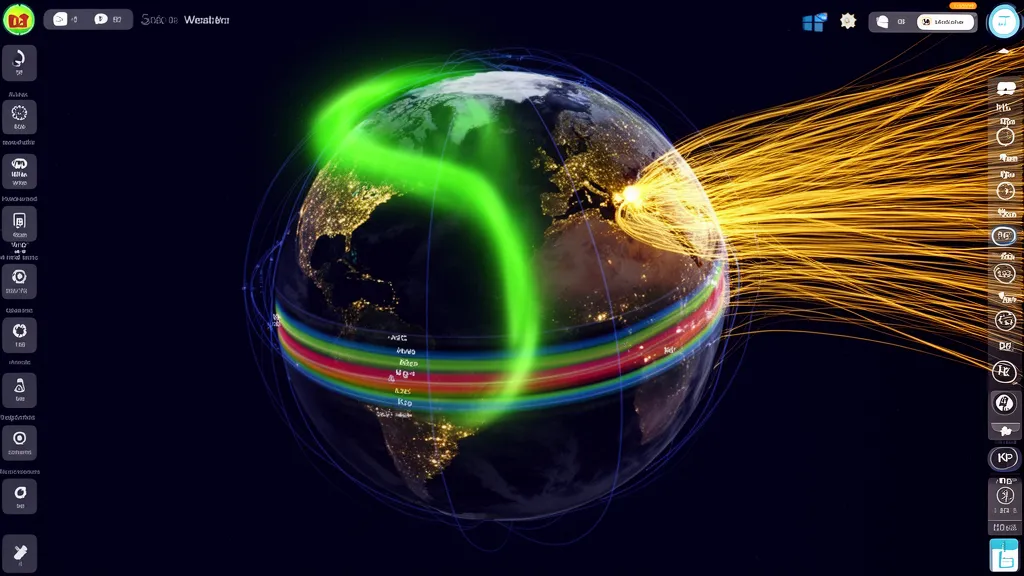
Operator's Verdict: Each layer shows a different dimension of current space weather — aurora oval for high-latitude disruption, Kp colours for geographic storm extent, solar wind animation for incoming activity. Rotate the globe to put your geographic region in view. Use it to check whether your planned path crosses the auroral oval before operating.
Why a 3D Globe?
Space weather data is inherently three-dimensional and geographic. A Kp number of 5 tells you something is happening, but it doesn't immediately show you whether that activity is affecting Germany-to-Japan polar paths, or whether mid-latitude Europe-to-East-Coast-US is clear. The globe translates abstract numbers into geographic visual context.
When you see the aurora oval expanded southward on the globe, you can immediately overlay your planned contact path mentally and judge whether it crosses the disturbed zone. No arithmetic required.
Pro Tip: Monitor DXRadar's solar weather dashboard for real-time space weather data — check it before every operating session.
The Globe Layers
Day/Night Terminator
The terminator line divides Earth's sunlit and night-time sides. This is propagation-critical information:
- Daytime (yellow/lit): D layer ionisation absorbs low HF bands (80m, 40m). F layer is present, supporting 20m, 15m, 10m.
- Night-time (dark): D layer dissipates, releasing 40m and 80m for long-distance NVIS. F layer thins, reducing support for very short 20m paths.
- Terminator (grey line): Paths crossing the terminator often benefit from enhanced propagation — the "grey line" or "grayline" effect where mixed ionospheric conditions can enhance certain paths.
Rotate the globe to see where the terminator falls relative to your location and target. If your path crosses the terminator at the right angle, consider operating on that band now.
Aurora Oval
The aurora oval layer displays the NOAA OVATION model's prediction of auroral activity footprint. The oval is a ring around the geomagnetic poles where particle precipitation from the magnetosphere heats the upper atmosphere and creates auroral displays.
What the oval means for radio:
- Paths through the oval experience radio aurora — ionospheric turbulence that can scatter VHF signals (enabling VHF contacts via aurora reflection) but disrupts stable HF paths
- D-layer absorption is enhanced within and equatorward of the active oval — the same mechanism that causes shortwave broadcast blackouts at high latitudes
- A large oval (expanded during Kp 5–7 storms) may cover Scandinavia, Canada, Alaska, and adjacent regions — eliminating polar paths
Look at the oval's southern edge (in northern hemisphere). If it extends south of 55° magnetic latitude (approximately UK, Germany, Canada), you can expect HF disruption at those latitudes.
Solar Wind Animation
The solar wind layer shows the DSCOVR satellite's real-time measurements of the solar wind plasma flowing past Earth's magnetosphere:
Speed (km/s):
- Quiet: 300–500 km/s
- Enhanced: 500–700 km/s
- High: >700 km/s (often associated with CME passage)
Density (particles/cm³):
- Quiet: 2–8 /cm³
- Enhanced: >10 /cm³ (dense solar wind can compress magnetosphere, raise Kp)
Direction (Bz component):
- This is the most critical parameter — shown separately in the solar weather dashboard
- Southward Bz (negative) allows magnetic field reconnection and geomagnetic storms
- Northward Bz is protective
The animation helps visualise the upstream conditions arriving at Earth's magnetosphere.
Kp Geographic Extent
The Kp colour layer converts the single Kp number into a geographic picture by showing which latitude bands are affected at current Kp values:
| Kp | Affected Magnetic Latitude | Geographic Equivalent |
|---|---|---|
| 2 | >66° | Northern Scandinavia, Arctic Canada |
| 4 | >58° | Southern Scandinavia, Scotland, southern Hudson Bay |
| 6 (G2) | >50° | Central Europe, New England, upper Midwest |
| 8 (G4) | >40° | Central France, Iowa, Pennsylvania |
When you see the Kp layer showing orange at 50°N latitude, paths through that region will experience HF disruption. A planned contact from the UK to northern Canada that passes through 60°N geographic latitude (which maps to about 55° magnetic) is clearly crossing the disrupted zone.
Using the Globe for Operating Decisions
Scenario 1: Planning a Europe–Japan polar path
Open the globe and rotate to show the polar region. Observe the aurora oval extent. If the oval is large and covers the high latitudes between Europe and Japan, the polar F2 path is likely disrupted. Consider:
- Using the longer mid-latitude path (shorter hop F2 to North America first, then transpacific)
- Waiting for Kp to drop below 3 before attempting the polar path
- Monitoring the path on 17m or 20m where the signal may punch through despite higher absorption
Scenario 2: Checking for aurora visibility
The globe's aurora oval shows the location and intensity of predicted aurora. If you're at a latitude that falls within or near the oval (60°N in Europe, Canada), the visual aurora is likely visible and radio aurora may be available for VHF contacts.
Scenario 3: Live solar storm monitoring
During an active Kp 7 storm, watch the globe in real time. As Kp rises, the Kp colour layer expands the orange/red zone toward lower latitudes. This directly shows which additional HF paths are becoming disrupted. When Kp drops back after a storm, you can see the aurora oval contracting in near-real-time as normalcy returns.
Access the globe at DXRadar's Space Weather Globe alongside the solar weather dashboard for the full picture.
Frequently Asked Questions
What does DXRadar's 3D globe show?
DXRadar's 3D globe visualises space weather data that affects radio propagation in real time. The globe displays multiple toggleable layers: the aurora oval (predicted auroral activity footprint at high latitudes), solar wind direction and speed (indicated by particle flow animation), current Kp index (colour-coded bands showing geomagnetic storm intensity by latitude), and the day/night terminator (where the Sun is illuminating Earth). These layers combine to show the current space weather environment affecting HF and VHF radio propagation at a glance, without reading multiple separate data tables.
How do I use the aurora layer for radio planning?
The aurora oval layer shows the predicted position of the auroral oval — the ring of geomagnetic activity around Earth's magnetic poles. When the oval is large (expanded equatorward), high-latitude HF paths are disrupted. When the oval is compact and near the poles, polar paths are unaffected. For radio purposes: if your path crosses the expanded auroral oval on the globe, expect signal absorption and path disruption. Paths that stay well south (in the northern hemisphere) of the oval are likely unaffected. This is more intuitive than looking at Kp numbers alone because the globe shows the actual geographic position relative to your paths.
What is the solar wind layer showing?
The solar wind layer shows animated particles flowing outward from the Sun, with speed and direction derived from NOAA's DSCOVR satellite measurements at the L1 Lagrange point (about 1.5 million km sunward of Earth). The animation is not a direct visualisation of the actual solar wind (which is invisible) but a representation of the measured speed and density scaled to help understand current conditions. High solar wind speed (>700 km/s) and high density (>10 particles/cm³) often indicate enhanced geomagnetic activity. Watching the animation gives an intuitive feel for the space weather environment.
What does the Kp colour layer mean?
The Kp colour layer overlays geomagnetic activity intensity as colour bands at different latitudes. Green regions indicate quiet conditions (Kp 0–3) — radio propagation is essentially unaffected. Yellow indicates minor disturbance (Kp 3–4). Orange/red indicates storm conditions (Kp 5–7) where HF polar paths are disrupted and auroral absorption affects high latitudes. At Kp 8–9 (severe storm), disruption extends to mid-latitudes. The geographic extent of coloured regions shows which latitudes are currently affected — essential for operators running polar paths (Europe–Japan, NA–Europe over the polar route).
How often does the globe update?
DXRadar's globe layers update at different intervals depending on the data source. Solar wind data from NOAA DSCOVR updates every 1 minute. The aurora oval forecast updates every 30 minutes (based on OVATION model). The Kp index updates every 3 hours (when a new planetary K estimate is published) with 1-minute local K estimates available between updates. The day/night terminator updates continuously in real time. Overall, the globe reflects current space weather conditions within 1–5 minutes of real-time for the solar wind layer and within 30 minutes for the aurora forecast.