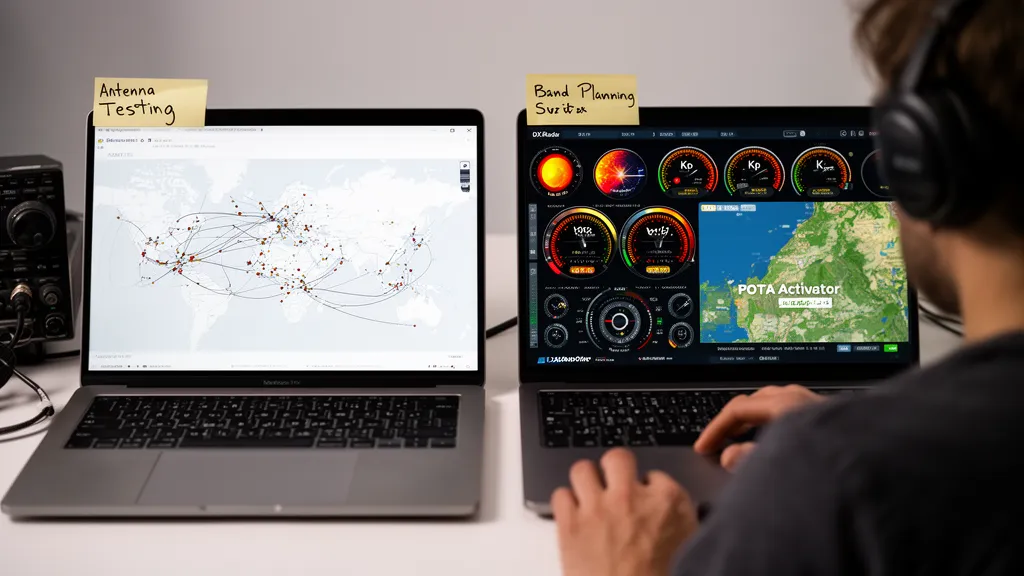
Operator's Verdict: Quick comparison: PSKReporter = granular digital mode reception data, per-station SNR, callsign search. DXRadar = propagation map integrated with solar weather context, DX cluster (SSB/CW), POTA activator data, aurora dashboard. Use PSKReporter for antenna testing; use DXRadar for integrated radio planning with space weather context.
Why Two Different Maps Exist
PSKReporter and DXRadar solve different problems. Understanding the distinction helps you use each for what it's actually designed for.
PSKReporter was created by Philip Gladstone as a reception reporting aggregator for digital modes. Its primary purpose is: "Where was my signal heard, and how well?" It's fundamentally a measurement and reporting tool.
DXRadar was created as a radio operator's propagation planning dashboard. Its primary purpose is: "What are conditions like right now, and how does that affect my planned operating?" It integrates propagation data with space weather context.
These are complementary tools, not competing alternatives.
Pro Tip: Use DXRadar's best bands now for a 30-second overview of which bands are open, then drill into PSKReporter if you need to see where your specific signal is reaching. For integrated planning with space weather context, DXRadar's solar weather dashboard gives you the "why" behind what you see on the map.
Data Sources: What Feeds Each Map
PSKReporter Data Flow
- You run WSJT-X (or similar) with reporting enabled
- WSJT-X decodes an FT8/FT4/MSK144/etc. signal
- The software automatically sends: transmitter callsign, receiver callsign (yours), frequency, mode, signal report (SNR in dB), timestamp
- PSKReporter aggregates all reports globally
- Map displays lines between transmitter and receiver locations
Key characteristics:
- Fully automated — requires no human action
- Only digital modes are reported
- Individual SNR values are available for every report
- Per-callsign search is possible
DXRadar Data Flow
DXRadar integrates multiple data sources:
- PSKReporter feed — digital mode propagation spots (filtered and aggregated)
- DX Cluster feed — manually submitted spots including SSB, CW, and digital DX contacts
- POTA API — official POTA activator spot data
- NOAA SWPC API — solar wind, Kp, SFI, X-ray flux
- NASA/ESA SDO — solar imagery
Key characteristics:
- Multi-source integration provides broader picture
- DX cluster spots include SSB/CW not in PSKReporter
- Solar weather context explains why propagation looks like it does
- Band condition synthesis (/best-bands-now, /band/[band]) adds interpretation layer
Comparing the Map Displays Side-by-Side
| Feature | PSKReporter | DXRadar |
|---|---|---|
| Digital mode spots | ✅ All digital modes | ✅ FT8/FT4 primary |
| CW spots | ⚠️ Only via software decoders | ✅ Via DX cluster |
| SSB voice spots | ❌ | ✅ Via DX cluster |
| Per-callsign search | ✅ | ❌ |
| SNR data | ✅ | ❌ |
| Solar weather integration | ❌ | ✅ |
| POTA activators on map | ❌ | ✅ |
| Aurora dashboard | ❌ | ✅ |
| Band condition summaries | ❌ | ✅ |
| 3D globe | ❌ | ✅ |
| Mobile-optimised | ⚠️ Partial | ✅ |
When to Use Each Tool
Use PSKReporter when:
- Antenna testing: Comparing two antennas using your own callsign spot history
- Diagnosing transmit issues: "Is my signal reaching anyone?" — search your callsign on PSKReporter
- Researching propagation history: What path was open between 1400–1600 UTC yesterday?
- Station discovery: What digital mode stations are transmitting in a specific area?
Use DXRadar when:
- Band planning before operating: Which bands are open right now?
- Space weather monitoring: Is a geomagnetic storm affecting my planned session?
- POTA chasing: Who is currently active, on what frequency, and how is propagation?
- Understanding why bands are poor: The solar weather integration explains the cause (flare, storm, solar minimum)
- All-in-one radio planning: One dashboard for propagation + space weather + DX cluster
The Grey Area: Both Work Fine
For simply checking whether a band is open between two general regions, both PSKReporter and DXRadar show geographic spot lines. If 20m is packed with transatlantic lines on either map, 20m is open transatlantically. The core propagation map function is broadly similar.
The differentiation comes in the depth:
- PSKReporter goes deeper into individual station analysis
- DXRadar goes broader into contextual radio planning
Most active HF operators benefit from bookmarking both. Check DXRadar's best-bands-now for the first 30-second overview, then drill into PSKReporter if you need to see where your signal specifically is or isn't reaching.
Frequently Asked Questions
What does PSKReporter show that DXRadar doesn't?
PSKReporter specialises in showing digital mode reception reports with individual station granularity — you can search for a specific callsign and see exactly who heard them, at what signal strength, and when. PSKReporter's raw data includes SNR (signal-to-noise ratio) for every reception report, making it useful for antenna comparison testing and diagnostics. PSKReporter also shows transmitter and receiver separately — not just 'contact was made' but 'this transmitter was heard by these receivers with these signal levels.' DXRadar does not currently provide per-callsign reception search or SNR analysis.
What does DXRadar show that PSKReporter doesn't?
DXRadar integrates propagation map data with solar weather context — SFI, Kp, X-ray flux, solar wind — in a single dashboard. DXRadar also shows DX cluster spots (not just digital mode contacts) and POTA activator locations on the same map. The solar weather integration means you can see at a glance whether a band degradation you observe on the map is caused by a solar event. DXRadar also provides the aurora dashboard, 3D space weather globe, and band-specific condition summaries (/band/20m, /band/10m, etc.) that PSKReporter does not offer.
Which map is better for checking if a band is open right now?
For the quickest check of whether a band is open, DXRadar's propagation map or best-bands-now page gives a faster, synthesised answer. The colour-coded band condition summary on /best-bands-now tells you green/yellow/red for each band without requiring you to interpret raw spots. If you need more detail — specifically, seeing individual spot lines to determine which geographic regions are connected — either PSKReporter or DXRadar's map (both show geographic spot lines) provides that information. The main difference is context: DXRadar wraps the map in solar weather data to explain why conditions are what they are.
Can I see SSB and CW contacts on PSKReporter?
PSKReporter only receives reports from digital mode software (WSJT-X, FLDIGI, JS8Call, etc.). CW contacts decoded by software (e.g., CW Skimmer) can appear on PSKReporter, but traditional SSB voice contacts never appear — there is no automated reporting mechanism for SSB. The DX cluster network (aggregated by DXRadar) contains SSB and CW spots submitted manually by operators. For a complete picture including SSB DX activity, the DX cluster component is essential — PSKReporter alone misses all voice DX.
Are the propagation maps real-time or delayed?
Both PSKReporter and DXRadar's propagation map display data with a slight delay: PSKReporter aggregates reports approximately every 5 minutes, so the newest spots are typically 2–7 minutes old. DXRadar fetches and displays PSKReporter and DX cluster data on a similar schedule. For HF propagation planning purposes, 5–7 minute data is effectively real-time — ionospheric conditions change on timescales of minutes to hours, not seconds. VHF sporadic-E openings can close within 30 minutes, so monitoring frequency should increase during active VHF openings.
What should I use for antenna testing and comparison?
PSKReporter's per-callsign search and SNR data make it better for antenna comparison. Transmit FT8 on a known frequency, then search PSKReporter for your callsign to see who heard you and at what SNR. Repeat with a different antenna. The SNR values reported by dozens of receiving stations worldwide provide statistically meaningful antenna performance data. DXRadar's map is not designed for this kind of per-station analysis — it focuses on propagation status rather than individual station performance metrics.