What VOACAP Is and Where It Came From
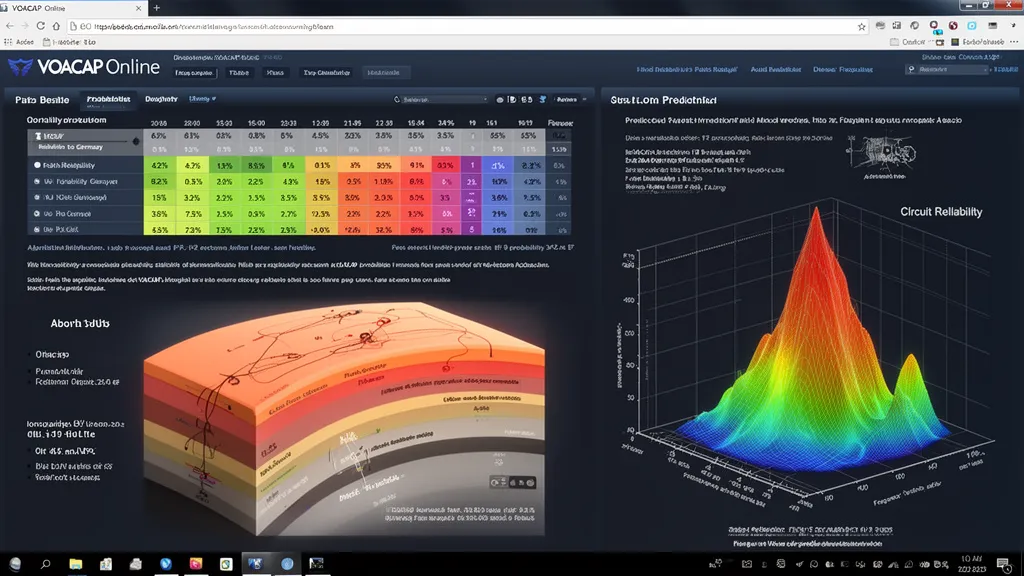
VOACAP (Voice of America Coverage Analysis Program) is a deterministic HF propagation prediction tool that calculates expected signal strength and circuit reliability for point-to-point HF paths. It was developed by the Institute for Telecommunication Sciences (ITS) under NTIA in 1993, evolving from the earlier IONCAP program originally written for the Voice of America to plan its worldwide shortwave broadcast coverage. It remains maintained by ITS and is the most widely used HF prediction tool in both professional and amateur circles.
The algorithm is grounded in ITU-R Recommendation P.533, the international standard for HF propagation prediction. This means VOACAP and the ITU-R method are not different approaches — VOACAP is an implementation of the ITU-R P.533 methodology, extended with additional propagation modes and refinements that ITS incorporated over decades of validation work.
For amateur radio operators, VOACAP is most accessible through web interfaces like voacap.com (maintained by Jari Perkiömäki OH6BG) and built into tools like HamCAP. Understanding what’s happening inside the model makes you a better interpreter of its outputs — and a better judge of when to trust it and when to disregard it.
How VOACAP Models the Ionosphere
VOACAP’s ionospheric model is built on the International Reference Ionosphere (IRI), a global empirical model developed from decades of ionosonde measurements. The IRI specifies electron density as a function of altitude, latitude, longitude, time of day, season, and solar activity.
The key ionospheric parameter in VOACAP’s calculation is foF2 — the critical frequency of the F2 layer, which determines the maximum vertical frequency that reflects from the F2 layer. For oblique paths, the MUF equals approximately foF2 × sec(θ), where θ is the zenith angle at the ionospheric reflection point (ITU-R P.1240-2).
VOACAP derives foF2 from monthly median maps called CCIR coefficients (Comité Consultatif International des Radiocommunications) — large lookup tables of ionospheric parameter coefficients as a function of geographic position, month, and solar activity index. The solar input is the smoothed sunspot number (SSN) or, equivalently, the solar flux index (SFI), which are related by an empirical conversion. A higher SFI input shifts the CCIR coefficient interpolation toward higher foF2 values, increasing MUF predictions across all paths.
This is a median model. It reflects what the ionosphere looks like on an average day in an average month at the given level of solar activity. It does not capture:
- Day-to-day variability in foF2 (which can be ±30% of median even under quiet conditions)
- Geomagnetic storm effects on the F2 layer
- Sporadic-E ionization
- Travelling Ionospheric Disturbances (TIDs)
VOACAP’s Required Inputs
To generate a prediction, VOACAP needs the following inputs. Understanding each one helps you configure the tool correctly for your specific scenario.
Transmitter and Receiver Parameters
- Location: Latitude and longitude (or grid square). VOACAP is a point-to-point model; it computes the path geometry from these coordinates.
- Antenna: The antenna gain pattern as a function of elevation angle. This is critical — a dipole at 10m height and a 6-element Yagi at 12m height on 20m have very different gain profiles at low elevation angles. Using the wrong antenna model produces predictions that are systematically off.
- Transmitter power: In watts or dBW. VOACAP uses this to calculate absolute received signal power in dBW.
Frequency
You can specify a single frequency or a list of frequencies. VOACAP evaluates each frequency independently. For amateur use, you typically run predictions for the center of each band (1.85 MHz, 3.6 MHz, 7.1 MHz, 14.15 MHz, 21.2 MHz, 28.5 MHz) to compare band performance.
Date and Time
VOACAP runs predictions for a specific month and UTC hour. It does not predict specific dates — it uses monthly median ionospheric coefficients. For time, you specify one or more UTC hours; the tool calculates the ionospheric state at each specified hour.
Solar Activity: SFI or SSN
The solar input is the single most influential parameter for high-band predictions. VOACAP accepts either:
- Smoothed sunspot number (SSN): Monthly 12-month smoothed average. Values range from ~0 at solar minimum to ~230+ at solar maximum.
- Solar flux index (SFI): The 10.7 cm radio flux in solar flux units (SFU). NOAA SWPC publishes daily SFI values. An SFI of 70 SFU represents deep solar minimum; 250 SFU is near the peak of Solar Cycle 25 activity levels.
The conversion between SSN and SFI is empirical and approximate:
- SFI ≈ 63.7 + 0.728 × SSN (valid for SSN 0–200; from ITS documentation)
For near-term planning, using the current observed SFI (rather than a smoothed SSN) gives a more relevant prediction, though you’re asking the monthly-median model to extrapolate from a daily measurement. For long-term planning (contest season, expedition scheduling), the smoothed SSN is more appropriate.
What VOACAP Calculates: Path Geometry and Signal Budget
Once VOACAP has its inputs, the calculation proceeds in several stages.
1. Path Geometry and Mode Selection
VOACAP computes the great circle path between transmitter and receiver, then calculates the geometry for 1-hop through typically 6-hop propagation modes. For a 3,000 km path, a single F2 hop is geometrically possible; for a 15,000 km path, 4 or 5 hops are required. VOACAP selects the mode (or combination of modes) that produces the highest received signal strength at each frequency.
For each hop, the reflection point is calculated. At the reflection point, VOACAP queries the CCIR model for foF2, then checks whether the frequency in use is below the path MUF. If the frequency exceeds the MUF, that mode cannot support propagation.
2. Free-Space Path Loss
The primary signal loss is free-space path loss (FSPL), which increases with the square of distance:
FSPL (dB) = 20 × log₁₀(d) + 20 × log₁₀(f) + 32.44
where d is path length in kilometres and f is frequency in MHz. This is independent of the ionosphere — it is simply the geometric spreading of signal energy over a spherical wavefront.
3. Ionospheric Absorption
HF signals passing through the D and lower E layers experience absorption — collisional damping that converts RF energy to heat. VOACAP calculates absorption using the Ramsay absorption formula, which integrates collision frequency along the ray path. Absorption:
- Increases with decreasing frequency (40m absorbs more than 20m on the same path)
- Peaks at solar noon (maximum D-layer ionization)
- Increases with solar flux (higher SFI = stronger D-layer = more absorption on lower bands)
- Increases at high latitudes (polar cap absorption during proton events, not modeled in standard VOACAP)
4. Ground Reflection Loss
Each Earth reflection adds 3–10 dB of loss depending on ground conductivity. Sea water: approximately 3 dB per reflection. Average land: 6–7 dB. Poor, dry desert: 9–10 dB. VOACAP uses ITU-R conductivity maps to estimate the ground type at each reflection point along the path.
A 5-hop path with 4 Earth reflections might accumulate 20–40 dB of ground reflection loss alone — a substantial factor on transoceanic paths.
5. Focusing Gain
Convergence of ray paths near the ionospheric reflection point produces a focusing gain of a few dB. This partially offsets path loss on some geometries. VOACAP includes this effect in the signal budget.
6. Output: Signal Strength and Reliability
VOACAP’s primary outputs:
- Predicted signal strength (dBW): Absolute received power at the receiver. Subtract receiver noise floor to get SNR.
- Signal-to-noise ratio (dB): Signal relative to the predicted atmospheric, galactic, and man-made noise floor (using ITU-R P.372 noise models).
- Reliability (%): The percentage of days in the month on which the SNR exceeds a user-specified required SNR threshold. A reliability of 90% on 20m means the path is usable 27 out of 30 days. This is arguably the most useful output for operating planning.
VOACAP’s Limitations: What It Cannot Tell You
Understanding where VOACAP fails is as important as understanding what it does well.
It Predicts Median Conditions Only
VOACAP’s ionospheric model reflects what the ionosphere does on a typical day. The actual ionosphere varies significantly day-to-day — foF2 can be 30% above or below its monthly median even under quiet conditions. A VOACAP prediction of 50% reliability means the circuit meets requirements about half the time; it says nothing about whether today is a good day or a bad day.
Geomagnetic Storms Are Not Modeled
During a geomagnetic storm (Kp 5 or higher), the F2 layer at high latitudes can be severely depleted or structurally distorted. VOACAP uses the quiet-time ionospheric model regardless of current Kp. Running VOACAP during a G2 storm will produce predictions that are systematically optimistic for trans-polar and high-latitude paths.
Sporadic-E Is Absent
VOACAP contains no sporadic-E model. On 10m, 12m, and especially 6m, VOACAP predictions should be understood as the F2-only baseline. Actual conditions on those bands can be dramatically better due to Es, without any warning from VOACAP.
Antenna Models Must Be Accurate
If you model your antenna as an isotrope (0 dBi in all directions) when you actually have a 3-element Yagi at 12m height, your signal predictions will be wrong. The antenna’s low-angle gain — typically 3–6° elevation for DX on 20m — is the critical parameter, and it varies significantly with height above ground and ground conductivity beneath the antenna.
VOACAP is a pre-contest and expedition planning tool. It tells you which bands and which UTC hours are theoretically viable for a given path under average conditions. It is not a real-time band-opening detector. Combine it with live spot data — DXCluster reports, PSKReporter — to know what’s actually open right now.
Using VOACAP Effectively for Amateur Radio
Pre-Contest Path Planning
Before a major DX contest (CQ WW, CQ WPX, ARRL DX), run VOACAP predictions for your target regions. Inputs: your antenna, your typical contest power, the current or expected SSN, each HF band from 40m through 10m. Output: a table showing which UTC hours each band is theoretically viable to each region.
This produces a band strategy map — for example, knowing that the 20m path from North America to Japan peaks in reliability around 10:00–14:00 UTC while the 15m path peaks at 12:00–16:00 UTC under current solar conditions. This is reproducible information from physics; the contest operators who know it have a structural advantage over those who guess.
Antenna Comparison
VOACAP is powerful for comparing antenna options before you build. Run the same path prediction with two different antenna patterns — your current inverted-V dipole at 10m versus a planned 2-element Yagi at 15m. The delta in predicted signal strength (dB) quantifies the real-world benefit of the antenna improvement on the specific paths you care about.
Why DXRadar Combines VOACAP with Live Spots
VOACAP predicts median conditions based on physics. PSKReporter and DXCluster report what’s actually happening right now — every decoded signal is empirical evidence that propagation exists on that path at this moment. DXRadar uses both layers: VOACAP-style modeling for theoretical path analysis, and live PSKReporter spot data for real-time confirmation. When a band shows live spots on paths that VOACAP predicts as marginal, the live data wins — the band is open.
When running VOACAP for DX planning, set your required SNR threshold to the minimum for your mode: approximately 3 dB for FT8, 10 dB for SSB, 0 dB for CW. Reliability percentages change significantly with this threshold — a path that’s 80% reliable for FT8 may be only 30% reliable for SSB on the same band and hour.
Frequently Asked Questions
What SFI value should I use in VOACAP for current predictions?
Use the most recent observed daily SFI from NOAA SWPC, available at swpc.noaa.gov. For long-term planning more than a month out, use the predicted smoothed SSN from NOAA’s Solar Cycle 25 forecast. Remember that VOACAP interpolates monthly median coefficients — inputting today’s daily SFI is a reasonable approximation, but the tool is designed around smoothed solar activity, not day-to-day variation.
Is VOACAP better than DX cluster spots for predicting propagation?
They answer different questions. VOACAP predicts whether a path should be open based on physics and solar conditions — it is systematic and covers all paths whether or not anyone is operating. DX cluster and PSKReporter show whether a path is open right now based on actual decoded signals — it is empirical and depends on active operators at both ends. Serious operators use both: VOACAP for planning, live spots for real-time confirmation.
Why does VOACAP sometimes predict a band as dead when it’s actually open?
VOACAP predicts median F2 propagation. It will underpredict when: sporadic-E is active (no Es model), the ionosphere is above-median for that day, or you’ve used a pessimistic antenna model. Conversely, VOACAP overpredicts when a geomagnetic storm has depressed the F2 layer. The tool is a statistical estimate, not a deterministic guarantee.
Can VOACAP model receive antennas?
Yes. VOACAP takes separate transmit and receive antenna patterns. If you’re comparing a Beverage receive antenna versus a dipole for DX reception on 160m, you can model both ends of the circuit with appropriate antenna gain vs. elevation angle profiles. The difference in predicted SNR reflects the real-world advantage of the better receive antenna.