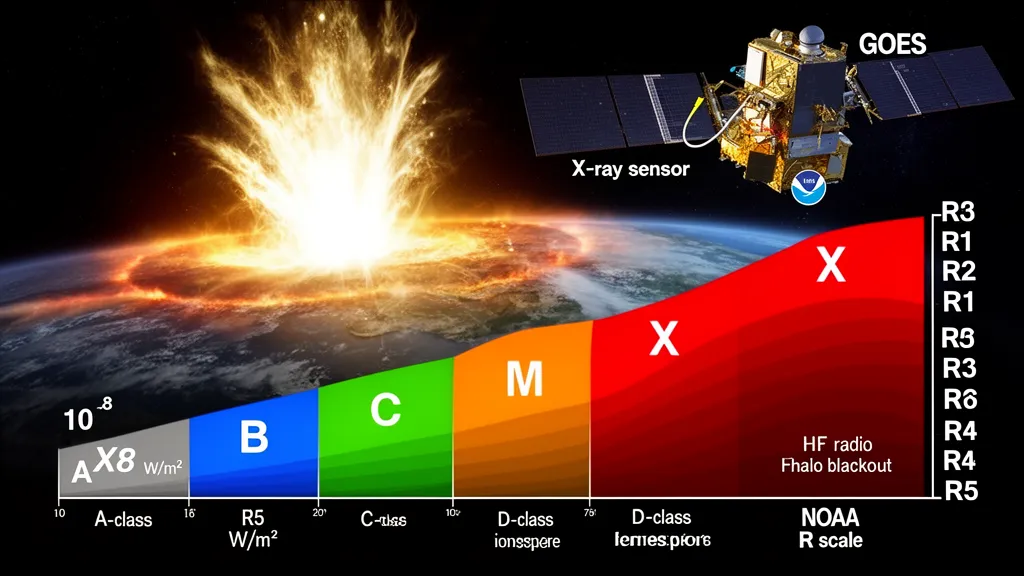
Operator's Verdict: The GOES X-ray sensor is reading B3.5 right now. Check the X-ray flux chart for the last 6-hour trend and any active flare events.
What the Flare Classification Scale Actually Measures
Solar flare classification tells you the peak soft X-ray flux reaching Earth's orbit, measured by GOES satellites in the 0.1–0.8 nm waveband (soft X-rays). The five letters — A, B, C, M, X — each represent a tenfold step in flux intensity. For radio operators, this single number determines whether the D layer will absorb your HF signal, how long the disruption will last, and which bands will be most affected.
The GOES instruments measure in watts per square metre (W/m²). Each letter class spans one order of magnitude:
| Class | Peak X-ray Flux (W/m²) | NOAA Radio Blackout | Typical HF Impact |
|---|---|---|---|
| A | < 10⁻⁷ | None | No impact |
| B | 10⁻⁷ to 10⁻⁶ | None | No impact |
| C | 10⁻⁶ to 10⁻⁵ | None (C5+: minor) | Minor low-latitude impact at C7+ |
| M1–M4 | 10⁻⁵ to 4×10⁻⁵ | R1 (Minor) | Low-band degradation on sunlit paths |
| M5–M9 | 5×10⁻⁵ to 10⁻⁴ | R2 (Moderate) | HF degraded 10–30 MHz on dayside |
| X1–X9 | 10⁻⁴ to 10⁻³ | R3 (Strong) | Wide HF blackout, dayside |
| X10–X19 | 10⁻³ to 2×10⁻³ | R4 (Severe) | Extreme HF blackout |
| X20+ | > 2×10⁻³ | R5 (Extreme) | Complete HF blackout, dayside |
The number suffix within each class is a linear multiplier. An M2.5 flare has a peak flux of 2.5×10⁻⁵ W/m². An X8 flare is at 8×10⁻⁴ W/m². This matters when you are reading NOAA alerts and want to understand how close you are to the next threshold.
A and B Classes: No Operational Impact
A and B class flares are background noise — they occur constantly, even at solar minimum, and produce no measurable HF impact. An A1 flare sits at 10⁻⁷ W/m², which is ten million times weaker than an X1. If the GOES monitor is showing steady A or B flux, the ionosphere is quiet and flare activity is not a factor in your propagation.
B-class flares occur daily during solar maximum but produce no D-layer enhancement worth noting. The GOES real-time chart will show occasional B-level spikes even on what appear to be quiet days. You can ignore them entirely for HF operating decisions.
The significance of A and B readings is their use as a baseline reference. When you see the X-ray flux sitting at A5 or B2 for hours at a time, you know the Sun is genuinely quiet — meaning any propagation issues you encounter are geomagnetic in origin, not flare-related.
C-Class Flares: Minor Impact on Low-Latitude Paths
C-class flares (10⁻⁶ to 10⁻⁵ W/m²) cause modest D-layer enhancement but rarely produce noticeable HF disruption. At C1–C4, the effect on most paths is negligible. Above C5, operators at low geographic latitudes (within approximately 30° of the equator) may notice slight degradation on paths below 10 MHz. The lower the band, the more susceptible to D-layer absorption.
A C7 or C9 flare during peak solar activity is essentially a non-event for 20m and above. On 40m and 80m, there may be a modest noise floor increase on the dayside for 10–15 minutes before the flux returns to baseline. C flares do not generate NOAA radio blackout alerts — they fall below the R1 threshold.
Pro Tip: If you track the X-ray flux on the DXRadar X-ray chart, you will notice that C-class flares occur regularly throughout the day during an active Sun. The sharp rise on the left edge of a flare profile and the exponential decay on the right is called the impulsive phase and the gradual phase. A fast rise with a slow decay is the classic signature of a real flare rather than instrument noise.
M-Class Flares: The Operational Threshold
M-class flares (10⁻⁵ to 10⁻⁴ W/m²) are the threshold at which HF radio operators need to pay attention. An M1 flare crosses into NOAA R1 (Minor) territory. At this level, signals below approximately 10 MHz on the sunlit side of Earth experience measurable D-layer absorption. The effect is similar to having your band "go long" suddenly — short-path contacts within 1,000–2,000 km may experience signal loss while longer paths remain workable.
M1 to M4: R1 Minor Blackout
An M1–M4 flare produces an R1 event. During an R1, HF propagation is degraded on the sunlit hemisphere only — the dark side of Earth is unaffected. Signals on 10, 15, and 20m are largely unaffected, but 40m and below may experience 5–10 dB of additional absorption for 10–30 minutes. Short-path stations within a few hundred kilometres of each other may lose the path entirely during the peak.
What it sounds like on 40m: a sudden increase in atmospheric noise, signals that were 57 dropping to 52–53, and marginal paths going into the noise. After 20–30 minutes, the flux returns to baseline and the path recovers.
M5 to M9: R2 Moderate Blackout
An M5 or higher flare crosses into R2 (Moderate). At this level, higher frequencies are affected — operators on 20m and 15m will notice signal degradation on dayside paths. Low-latitude HF circuits below 10 MHz may experience complete path loss for 30–60 minutes. The recovery is gradual, following the exponential decay curve visible on the GOES X-ray plot.
NOAA issues an R2 alert automatically when peak flux exceeds 5×10⁻⁵ W/m². Check the DXRadar solar weather page for active alerts.
X-Class Flares: Significant to Extreme Blackouts
X-class flares (above 10⁻⁴ W/m²) cause significant to extreme HF blackouts on the entire sunlit hemisphere. An X1 flare (10⁻⁴ W/m²) triggers an R3 alert. Frequencies from 10 to 30 MHz may be completely absorbed on the dayside for one to two hours. An X5 flare (5×10⁻⁴ W/m²) extends the blackout to lower frequencies and longer durations.
X1 to X9: R3 Strong Blackout
During an R3 event, the usable HF spectrum on the dayside can collapse from its typical upper limit down toward the VHF threshold. An experienced operator working 15m CW during an X2 flare will hear the band go progressively quieter — not the sharp QSB of ionospheric fading, but a gradual absorption where all signals drop simultaneously. That is the D-layer smothering everything above it.
The dark hemisphere is unaffected. If you are at night and see a solar flare alert, you can continue operating normally. Stations on the other side of the terminator are your main casualty.
X10 and Above: R4–R5 Events
X10–X19 flares trigger R4 (Severe) blackouts. Below about 20 MHz, HF becomes unusable on the dayside for multiple hours. These events are rare — the solar cycle produces only a handful of X10+ events per cycle.
X20 and above produces an R5 (Extreme) event, the most severe NOAA radio blackout classification. The strongest flare on the modern instrumental record was estimated at X28 (with some analyses suggesting X45), recorded on November 4, 2003, during the historic Halloween solar storms (NOAA SWPC). The GOES sensor saturated at X17.4 before the flare peaked, requiring post-event reconstruction of the peak flux. The May 2024 superstorm sequence included an X8.7 flare on May 14, 2024 — the largest of Solar Cycle 25 at the time.
The Afterglow: Improved Conditions Post-Flare
Here is a counterintuitive but operationally useful effect: a major X-class flare can improve HF conditions on the dark hemisphere and on recovering dayside paths 30–90 minutes after peak. The flare's UV and EUV component drives elevated F2 ionization. Once the D-layer absorption subsides, the MUF on F2 paths is temporarily higher than pre-flare levels. Experienced DX operators watch for this window.
The recovery window is short — typically 30–90 minutes — and not guaranteed on all paths. However, on the dark hemisphere, there is no D-layer penalty, and the enhanced F2 from the flare can produce genuinely unusual openings on 10m and 12m that would not otherwise occur at that time of day or SFI level.
The NOAA R-Scale: What Radio Operators Should Know
The NOAA Space Weather R-scale (R1–R5) maps directly to flare class and tells you the expected operational impact. NOAA generates automatic alerts when peak flux crosses each threshold:
| NOAA R-Scale | Flare Class | Minimum Flux (W/m²) | HF Impact |
|---|---|---|---|
| R1 (Minor) | M1–M4 | 10⁻⁵ | Low-band degradation, high latitudes most affected |
| R2 (Moderate) | M5–M9 | 5×10⁻⁵ | Degradation 10–20 MHz dayside, path loss on low bands |
| R3 (Strong) | X1–X9 | 10⁻⁴ | Wide HF blackout 10–30 MHz dayside; 1–2 hr duration |
| R4 (Severe) | X10–X19 | 10⁻³ | Extreme HF blackout, most dayside paths unusable |
| R5 (Extreme) | X20+ | 2×10⁻³ | Complete HF blackout dayside; full recovery takes hours |
NOAA's alerting threshold is automated — the R scale applies even if the source active region is poorly positioned on the solar disk and the flare is not Earth-directed. A flare from the eastern limb of the Sun hits Earth's sunlit side with full X-ray intensity regardless of where the CME associated with it travels.
Reading the GOES X-ray Plot
The DXRadar X-ray chart displays GOES data in real time. The plot shows two channels: GOES short channel (0.5–4.0 Å) and GOES long channel (1–8 Å). The flare classification uses the long channel (1–8 Å, equivalent to 0.1–0.8 nm). The horizontal lines on the chart mark the A, B, C, M, and X thresholds.
A flare profile on this chart has a characteristic shape: fast rise (impulsive phase, seconds to minutes) and a slow exponential decay (gradual phase, minutes to hours). The peak of the long channel profile determines the flare class. NOAA event lists record the start time (when flux begins rising), peak time (maximum flux), and end time (return to pre-flare level).
Time from flare peak to maximum D-layer absorption is roughly 8 minutes — the time for X-rays to travel from the Sun to Earth. If you see a flare peak on the real-time chart, you have essentially zero warning time. The blackout is already happening or starting.
Frequently Asked Questions
What are the solar flare classes in order?
Solar flare classes in order from weakest to strongest are A, B, C, M, and X. Each class is ten times more powerful than the previous. A number suffix (1–9 for A–M, and 1+ for X) gives the exact flux within each class. An X2 flare is twice as intense as an X1.
What is the strongest solar flare ever recorded?
The strongest solar flare on the modern instrumental record occurred on November 4, 2003, during the Halloween solar storms. The GOES sensor saturated at X17.4, but post-event analysis by NOAA SWPC estimated the peak at approximately X28, with some published analyses suggesting it may have reached X45. It produced one of the most severe HF blackout events in recorded history (NOAA SWPC).
Does a solar flare affect the whole Earth?
No. Solar flare X-ray effects — including HF radio blackouts — affect only the sunlit hemisphere. X-rays travel at the speed of light and ionize the D layer only where the Sun is above the horizon. Stations in darkness experience no blackout from the flare itself. (Associated CME effects, if any, affect the whole magnetosphere when they arrive 1–3 days later.)
How do I know if a solar flare is happening right now?
Check the DXRadar X-ray flux chart. The current GOES flux is shown in real time. If the flux is in the M or X class range and rising, a flare event is in progress. NOAA issues automatic alerts for R1 and above events, which appear on the solar weather dashboard.
What frequency is most affected by an M-class flare?
Lower HF frequencies are most affected. During an R1–R2 event, bands below 10 MHz (40m, 60m, 80m, 160m) experience the greatest D-layer absorption. Bands above 20 MHz typically see less impact during M-class events. During major X-class R3+ events, the entire HF spectrum on the dayside can be disrupted.
For companion reading, see Solar Flare Effects on Ham Radio and Understanding the K-Index. Monitor current X-ray conditions on the DXRadar X-ray chart.