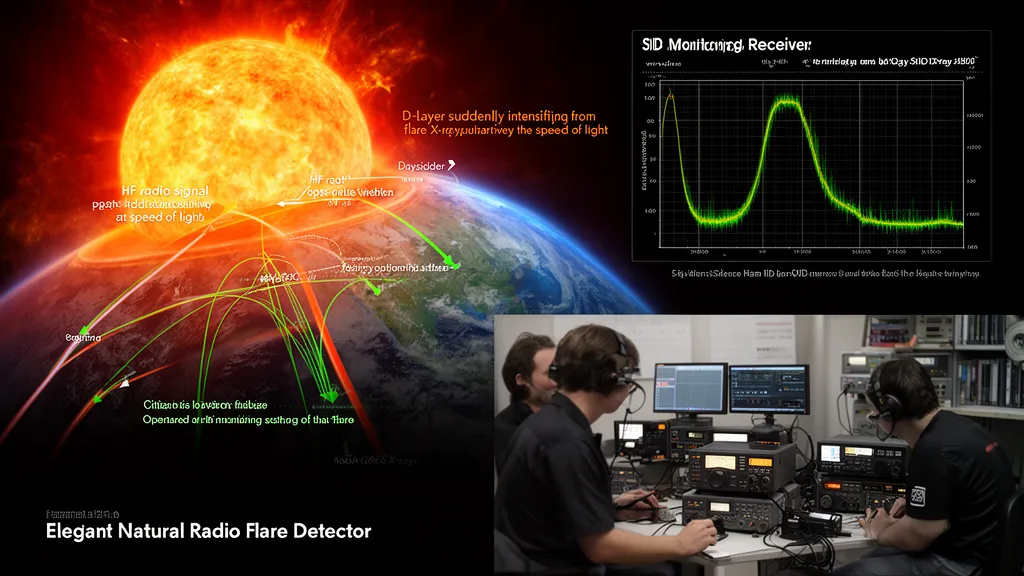
What a Sudden Ionospheric Disturbance Is
A Sudden Ionospheric Disturbance (SID) is the ionospheric response to the X-ray and extreme ultraviolet (EUV) emission of a solar flare — specifically the enhancement of the D-layer electron density across the entire sunlit hemisphere that causes simultaneous HF absorption and VLF signal enhancement. SIDs are also called the Dellinger effect or shortwave fadeout (SWF), names that predate the modern terminology.
The causative mechanism is photoionization. Solar flares emit radiation across a wide spectrum, but the D-layer ionization relevant to SIDs is driven primarily by hard X-rays in the 0.1–1 nm range and soft X-rays in the 1–10 nm range — the same wavelengths measured by NOAA GOES satellites as the X-ray flux that defines flare classes. When X-ray flux increases by a factor of 10 to 10,000 above background, the D-layer electron density increases proportionally, thickening the absorbing layer from its normal ~5 km depth to 10–20 km or more.
The effect is strictly limited to the sunlit hemisphere. The D-layer exists only in daylight — it forms when solar UV illuminates the mesosphere at 60–90 km altitude. At night, the D-layer effectively disappears because the ionizing radiation is absent. This geographic lock means you can identify the local time at your QTH from the onset of an SID: if it happens at your location, it is daytime. If a distant station reports an SID while you have none, the flare region illumination geometry explains the difference.
The Radio Signatures: HF Down, VLF Up
SIDs produce two complementary, simultaneous radio effects that experienced operators can identify independently.
HF Absorption (The Shortwave Fadeout)
On HF, the SID manifests as the rapid loss of signals in the 1.8–30 MHz range, starting on lower frequencies and extending upward with increasing flare intensity. During an M-class flare (R1–R2), operators on 40m and 80m notice signals dropping 10–20 dB within minutes, while 20m and above remain partially usable. During an X1–X3 flare (R3), most of HF below 20 MHz goes silent. During an X10+ event (R4), the entire HF spectrum on the dayside can collapse.
The D-layer absorption is frequency-dependent. Absorption goes as 1/f² — doubling frequency reduces absorption by a factor of four. This means 80m (3.5 MHz) suffers 16× more absorption than 15m (21 MHz) under identical D-layer conditions. During a marginal SID from a C-class flare, only 80m and 40m may show noticeable degradation. During an extreme X-class event, even 10m and 12m show absorption, though they recover fastest.
What operators hear: During an SID onset on a busy contest band, experienced operators describe the noise floor rising and signals compressing simultaneously — S9 signals dropping to S3–S4 within 2–3 minutes, then continuing to drop until the band sounds like a dead carrier with occasional ghost signals. The effect is sometimes described as "the band turning to mud." Recovery is gradual — the reverse of onset, taking 15–60 minutes for most flares.
VLF Enhancement (The Opposite Effect)
At VLF frequencies (below 30 kHz), the SID produces the opposite effect: signal amplitude increases. This seems counterintuitive until the propagation geometry is understood.
VLF propagation occurs in a waveguide formed between the Earth's surface and the bottom of the ionosphere. At normal D-layer heights (70–90 km), this waveguide is relatively deep. When the D-layer is enhanced and descends (or the effective reflection height lowers), the waveguide narrows, changing the interference pattern between ground wave and sky wave components. For most stable VLF paths and frequencies, this produces an amplitude increase detectable with simple monitoring equipment.
The enhancement typically appears as a sudden step up in received signal strength — hence "sudden" in the name — followed by a slower recovery as the flare decays and the D-layer returns to its normal state.
The VLF enhancement is the key to citizen-science SID monitoring. You cannot easily build a sensitive enough HF monitoring setup to quantify absorption, but a simple VLF receiver with a loop antenna, a sound card ADC, and free software can detect the amplitude change on NAA (24.0 kHz) or NWC (19.8 kHz) with a setup that fits on a desk.
SID Intensity vs. Flare Class
SID intensity correlates directly with X-ray flare class, though the relationship has scatter because the ionizing efficiency also depends on the flare's spectral hardness and its position on the solar disk.
| Flare Class | NOAA X-ray Flux | SID Detectable? | HF Impact |
|---|---|---|---|
| A | < 10⁻⁷ W/m² | No — below background | None |
| B | 10⁻⁷ to 10⁻⁶ W/m² | No | None |
| C1–C5 | ~10⁻⁶ W/m² | Marginal, instruments only | Slight 80m degradation |
| C6–C9 | ~5×10⁻⁶ W/m² | Yes, sensitive stations | 80m and 40m minor degradation |
| M1–M4 | 10⁻⁵ W/m² | Clearly detectable | 40m–80m R1 blackout |
| M5–M9 | ~5×10⁻⁵ W/m² | Strong | 20m–80m R2 blackout |
| X1–X9 | 10⁻⁴ W/m² | Very strong | All HF R3 blackout |
| X10+ | > 10⁻³ W/m² | Extreme | Extended R4–R5 blackout |
Flares from active regions near solar disk center produce stronger SIDs than the same class flare at the solar limb, because limb flares emit more radiation tangentially to Earth rather than directly. This is relevant when reading NOAA active region coordinates: an X1 from a region at S15W05 (near disk center) will produce a stronger SID than an X2 from S10E80 (near eastern limb).
Monitoring SIDs: The VLF Station Network
SID monitoring uses VLF navigation and communication transmitters that have been operating continuously for decades — providing a stable reference against which D-layer perturbations are measured.
Primary monitoring frequencies and stations:
| Call | Frequency | Location | Power | Coverage |
|---|---|---|---|---|
| NAA | 24.0 kHz | Cutler, Maine USA | 1,000 kW | Americas, Europe |
| NWC | 19.8 kHz | Harold E. Holt, W. Australia | 1,000 kW | Pacific, Indian Ocean |
| GQD | 22.1 kHz | Anthorn, UK | 300 kW | Europe, Africa |
| DHO38 | 23.4 kHz | Rhauderfehn, Germany | 800 kW | Europe, Middle East |
| JJI | 22.2 kHz | Ebino, Japan | 400 kW | East Asia, Pacific |
These are naval communication transmitters used for communication with submarines — they operate continuously at megawatt effective radiated power, providing stable, high signal-to-noise reference signals.
The Stanford SID Monitoring Program
Stanford University's Solar Center has operated a citizen-science SID monitoring network since 2004. Participating observers — including many licensed amateur radio operators — use Stanford-designed or equivalent receivers, a loop antenna, and software to record VLF amplitude continuously and submit data to the Stanford archive.
The network has contributed to published research on solar flare X-ray spectral characteristics, D-layer physics, and the correlation between SID magnitude and GOES X-ray measurements. For operators interested in scientific contribution, it represents a straightforward way to do meaningful solar physics research with ~$50 in hardware.
Building a simple SID receiver:
- A small air-core loop antenna (approximately 0.5–1 m diameter) wound with 100–200 turns
- A simple pre-amplifier tuned to the target frequency (24 kHz for NAA)
- A PC sound card sampling at 44.1 or 96 kHz provides adequate bandwidth
- Free software: SuperSID (Stanford-distributed), ARGO, or SPECTRUM LAB
Reception of NAA at 24.0 kHz is possible from most of the continental US, Canada, and Europe. The signal is strong enough that even a small indoor loop antenna often suffices for amplitude monitoring purposes, if not directional work.
Post-SID Recovery: When Bands Return
Recovery from an SID follows a predictable sequence as X-ray flux declines after flare peak:
- Flare decay begins — X-ray flux drops from peak. Ionization source reduces.
- Upper HF recovers first — 10m signals return within 5–15 minutes of flux beginning to decline.
- Mid-HF recovery — 15m, 17m, 20m recover within 10–30 minutes of peak.
- Lower HF recovery — 40m recovers within 15–45 minutes. 80m may take up to 60 minutes.
- D-layer returns to normal — typically complete within 60–90 minutes for M-class events.
For X-class flares, recovery timelines scale with flare class and duration. An X1 might clear in 30–45 minutes total. An X10 may keep 40m absorbed for 90–120 minutes after peak.
Operators can monitor recovery in real time by watching the GOES X-ray flux plot on DXRadar's X-ray page. When the flux drops back below the M1 threshold (10⁻⁵ W/m²), lower HF bands are approaching recovery. When flux returns to C-class or below, all bands should be clearing.
Operator's Verdict: During a solar flare, watch DXRadar's X-ray chart for the declining slope — that is your recovery timer. The bands typically recover in the same sequence they degraded: 10m first, 80m last. If you are mid-contest and the band goes silent, the X-ray plot tells you how long to wait.
SIDs and Polar Cap Absorption: A Critical Distinction
SIDs affect the entire sunlit hemisphere symmetrically. Polar Cap Absorption (PCA) is a different phenomenon that can follow a major flare-associated energetic proton event and affects specifically the polar regions regardless of day/night.
PCA occurs when solar energetic protons (SEPs) — particles accelerated in a flare or CME shock — follow magnetic field lines into the polar caps, ionizing the D-layer at high latitudes. PCA can persist for days after the originating flare, because protons remain trapped and precipitate continuously. A transpolar path (e.g., Midwest USA to Central Europe) can remain absorbed for 24–72 hours after a major proton event, while lower-latitude paths recover normally.
During the October 2003 Halloween storms, PCA on transpolar paths persisted for roughly 48–72 hours per major event. Operators at mid-latitudes who switched to non-polar paths (e.g., long-path from the US to Europe via the Southern Hemisphere) could often work DX when the short polar path was completely absorbed.
Frequently Asked Questions
What is a Sudden Ionospheric Disturbance?
A Sudden Ionospheric Disturbance is a rapid increase in D-layer ionization across the sunlit hemisphere caused by X-ray and UV emission from a solar flare. It produces simultaneous HF absorption (shortwave fadeout) and VLF amplitude enhancement, both beginning within 2–8 minutes of flare onset. The effect is limited to the sunlit side of Earth.
How fast does a Sudden Ionospheric Disturbance occur?
X-ray radiation travels from the Sun to Earth in 8.3 minutes. Ionospheric response is nearly instantaneous on that timescale. Operators monitoring real-time GOES X-ray data will see the flux increase 8 minutes after flare onset; HF bands begin degrading simultaneously with the flux increase reaching the ionosphere.
Can ham radio operators detect Sudden Ionospheric Disturbances?
Yes. The Stanford SID Monitoring Program supports amateur participation with simple VLF receivers monitoring stations like NAA at 24.0 kHz. The required hardware costs approximately $50 in components and an existing PC. During X-class flares, the amplitude response is clearly visible in real-time monitoring data.
What is the Dellinger effect?
The Dellinger effect is an older term for shortwave fadeout — the HF signal loss component of an SID. J.H. Dellinger of NIST characterized these events systematically in the 1930s, providing the first rigorous scientific description of what operators had observed since HF radio became widespread in the 1920s.
Which VLF stations are best for SID monitoring?
NAA (24.0 kHz, Cutler, Maine) is the most commonly used reference for the Americas and Europe. NWC (19.8 kHz, Western Australia) covers the Pacific. Both transmit at 1,000 kW continuously, providing stable and strong reference signals at most locations in their coverage area.