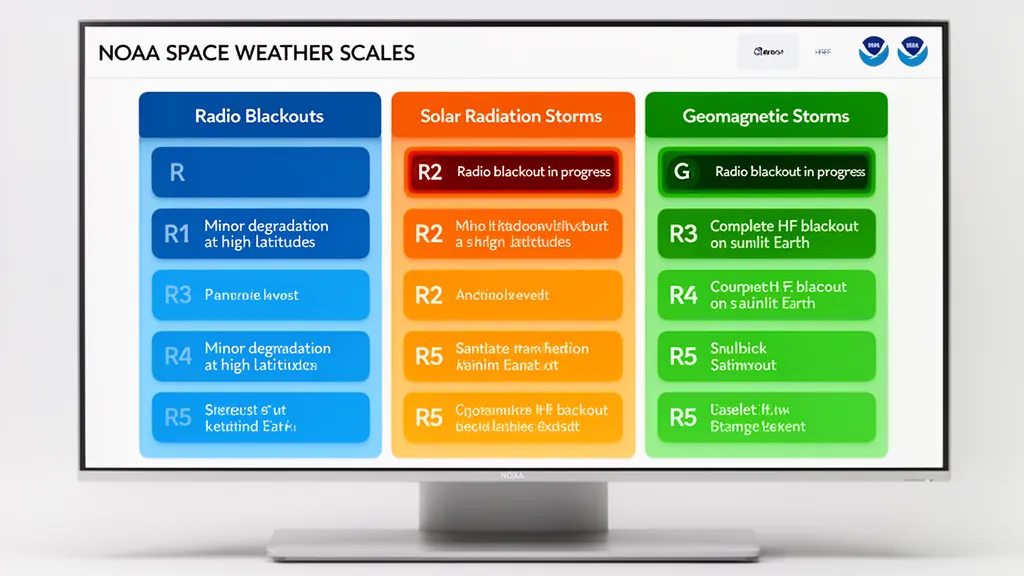
Operator's Verdict: Check the R, S, and G scale indicators before activating or starting a contest session — an R2 event will kill 40m and 80m on the dayside; a G3 makes polar paths unreliable.
Why NOAA Created Three Separate Scales
Before NOAA introduced the R, S, and G scales in 1999, space weather events were described using a heterogeneous mix of flare classifications, K-index values, and proton flux thresholds. Different agencies used different terminology, making communication between meteorologists, emergency managers, satellite operators, and radio operators inconsistent and error-prone.
The three scales solve this by providing a standardized, public-facing summary of space weather severity — analogous to the Saffir-Simpson hurricane scale or the Richter scale for earthquakes. Each scale runs 1 to 5 and is designed so each step represents approximately 10× more severe conditions than the previous step.
Each scale addresses a distinct physical cause and effect:
- R scale: Solar flare X-ray emission → D-layer ionization → HF absorption on the dayside hemisphere
- S scale: Solar energetic particles (SEPs) → polar region particle precipitation → polar cap absorption and satellite effects
- G scale: Coronal mass ejection (CME) → geomagnetic storm → global HF disruption, aurora, power grid effects
These three causes operate on different timescales and affect different radio paths. Understanding which scale is active during a space weather event determines the appropriate operational response.
The R Scale: Radio Blackouts from Solar Flares
The R scale measures the severity of HF radio blackouts caused by the X-ray flux from solar flares. It is directly tied to the X-ray flare classification system and updates in near-real time based on GOES satellite X-ray measurements.
R-scale trigger thresholds and HF effects:
| Level | Flare Class | Peak X-ray Flux | Duration | HF Effect on Dayside |
|---|---|---|---|---|
| R1 | M1–M4 | 10⁻⁵ to 4×10⁻⁵ W/m² | ~1 hour | Minor degradation, 30–80m affected |
| R2 | M5–M9 | 5×10⁻⁵ to 10⁻⁴ W/m² | ~2 hours | Limited blackout, 10–80m degraded |
| R3 | X1–X9 | 10⁻⁴ to 10⁻³ W/m² | ~1 hour | Wide-area blackout, 10–30m affected |
| R4 | X10–X19 | 10⁻³ to 2×10⁻³ W/m² | ~2 hours | Intense blackout, most HF affected |
| R5 | X20+ | > 2×10⁻³ W/m² | 4+ hours | Extreme blackout, complete HF failure |
The frequency selectivity of R-scale events is critical for operating decisions. D-layer absorption follows the 1/f² relationship — doubling frequency reduces absorption by 75%. This means:
- R1 (M1–M4): 80m and 40m noticeably degraded; 20m and above largely unaffected at low and mid-latitudes.
- R2 (M5–M9): 40m and 80m severely affected; 20m partially degraded; 15m and above often usable.
- R3 (X1–X9): All frequencies below 20 MHz heavily absorbed; 15m and 17m marginal; 10m and 12m partially usable briefly.
- R4 (X10–X19): All HF below 30 MHz severely affected; recovery takes 1–2 hours after peak.
- R5 (X20+): Complete HF blackout on the dayside for 4+ hours; even 10m fails to support propagation.
R-scale events are dayside only. Your nightside QTH is unaffected. If you are operating at 04:00 UTC (nighttime in North America) during an R4 event caused by a flare, your propagation to Europe via the nightside path may actually be excellent.
During R3 events, experienced contest operators immediately shift all contacts to 10m and 12m — the high-frequency end of HF where absorption is least. An R3 flare that kills 40m–80m may leave 10m with only 3–6 dB absorption, barely noticeable to a station with a directional antenna. Shift high and keep working.
The S Scale: Solar Radiation Storms and Polar Cap Absorption
The S scale measures energetic proton events — specifically the flux of solar energetic particles (SEPs) with energy greater than 10 MeV measured by NOAA GOES satellites.
S-scale thresholds and effects:
| Level | Proton Flux (> 10 MeV) | Primary Radio Effect | HF Impact |
|---|---|---|---|
| S1 | 10 pfu | Navigation errors increase | Minor polar route degradation |
| S2 | 100 pfu | Passengers and crew exposed at poles | HF polar routes degraded |
| S3 | 1,000 pfu | Polar cap absorption begins | HF through polar regions fails |
| S4 | 10,000 pfu | Satellite memory upsets | HF polar and high-latitude paths blacked out |
| S5 | 100,000 pfu | Satellite operations may fail | Complete polar cap absorption, days-long |
Polar Cap Absorption (PCA) is the dominant radio effect of S-scale events. When energetic protons follow magnetic field lines into the polar caps, they ionize the D-layer at high latitudes (above approximately geomagnetic 60°). This creates a zone of intense absorption that affects any HF path transiting through the polar region, regardless of local time or day/night.
At S3 and above, transpolar paths are effectively destroyed for the duration of the proton event plus its decay period. The path from the continental United States to Northern Europe via the Arctic — normally an excellent 20m and 17m path — becomes completely absorbed. The path from Japan to Europe via the polar route fails similarly.
The recovery time for PCA is measured in days, not hours. Unlike an R-scale flare event that clears when X-ray flux drops, SEPs are magnetically trapped and continue precipitating for 24–72 hours or longer. Operators who rely on polar routing — particularly those in the Pacific working European stations — may need to switch to long-path routing for 1–3 days after a major proton event.
During an S3+ event, rethink your propagation geometry. US West Coast to Germany: short path transits the Arctic and will be blacked out. Long path — going east through the Pacific, Indian Ocean, and Middle East — avoids the polar cap entirely. Long path length from Los Angeles to Berlin is approximately 16,300 km vs 9,300 km short path. The extra propagation distance is well worth the difference if the short path is absorbed.
The G Scale: Geomagnetic Storms from CMEs
The G scale measures geomagnetic storm intensity, directly correlated to the planetary K-index (Kp). Where R and S events are caused by radiation and particles respectively, G events are caused by coronal mass ejections (CMEs) — clouds of magnetized plasma ejected from the Sun that take 1–4 days to reach Earth.
G-scale thresholds and HF effects:
| Level | Kp | Storm Duration | HF Effect | Aurora Visibility |
|---|---|---|---|---|
| G1 | 5 | Hours | High-latitude HF degraded, polar routes affected | Geomagnetic lat 60° |
| G2 | 6 | Hours | HF radio effects at higher latitudes, Kp5-6 | Geomagnetic lat 55° |
| G3 | 7 | Hours to day | HF radio degraded on many paths, intermittent blackout | Geomagnetic lat 50° |
| G4 | 8 | 1–2 days | Widespread HF radio propagation problems | Geomagnetic lat 45° |
| G5 | 9 | 1–3 days | HF radio blackout on most paths, severe disruption | Geomagnetic lat 40° |
Unlike R-scale events that are dayside-only, G-scale events affect the entire globe simultaneously — both hemispheres, both day and night sides. The ring current enhancement that drives the Kp increase affects the F2 layer globally, not just on the dayside.
The band-by-band impact of G-scale events differs from flare events:
- G1–G2: Primarily affects high-latitude paths (polar-adjacent routes, Scandinavia to North America, Alaska paths). Mid-latitude operators often notice only mild degradation or nothing at all.
- G3: HF paths in the 40°–60° latitude band begin to degrade. F2-layer MUF depression reduces the usable frequencies on transatlantic paths. 10m and 15m may become unreliable even at mid-latitudes.
- G4: Widespread disruption. The F2 layer is disturbed globally. 10m, 12m, and 15m essentially fail. 20m and 17m become unreliable. 40m and NVIS on 80m remain viable for regional communication.
- G5: Near-complete HF blackout on most paths. 40m NVIS may still function for distances out to 600–800 km at mid-latitudes. 160m and 80m NVIS for very short paths. This is the emergency communication scenario where amateur radio operators fill the communication gap.
G-scale events also create VHF opportunities. As the auroral oval expands equatorward during G3–G5 events, aurora scatter on 6m (50 MHz) becomes available to stations in Scandinavia, Scotland, and northern North America at G3, and extends further south with increasing storm intensity.
When All Three Scales Combine: The Major Event Scenario
The most significant space weather events involve all three scales simultaneously in a rapid-fire sequence:
- Hour 0: X-class solar flare. R3–R5 event begins immediately. HF blackout on the dayside.
- Hours 0.5–2: Energetic protons arrive. S2–S4 event begins. Polar cap absorption starts.
- Days 1–3: CME arrives. G3–G5 event begins. Global HF disruption, aurora, ground currents.
The October 28–29, 2003 Halloween storms exemplified this sequence. On October 28, an X17 flare caused R4 conditions. The associated proton event reached S3. The CME arrived October 29 and drove a G5 storm. A second major flare on October 29 produced an estimated X28 event — the largest ever recorded — triggering another R5 blackout on top of the ongoing proton and geomagnetic storm sequence.
During those events, HF was essentially useless on dayside paths for the blackout periods, polar paths absorbed for days from the proton events, and global HF severely degraded during the G5 main phases. Amateur radio operators who had 80m NVIS stations and local power backup were the reliable regional communication assets.
Reading NOAA Scales on DXRadar
DXRadar displays current R, S, and G scale alert levels on the solar weather dashboard, updated continuously from the NOAA SWPC alert feed. The X-ray flux chart on the X-ray page shows the GOES 1–8 Ångström channel in near-real time — you can watch an R-scale event develop and track recovery.
Practical workflow:
- Morning check: look at Kp history for the past 24 hours (G-scale context) and the 3-day forecast (CME arrival risk)
- Pre-activation: check current X-ray flux level (R-scale risk) and proton flux (S-scale status)
- During operation: if you hear the band go quiet unexpectedly, check the X-ray chart — R-scale onset is the most likely cause during solar maximum
Bookmark DXRadar's solar weather page as your pre-operating checklist. A 30-second look at current R, S, and G scale indicators before you transmit is the difference between a productive session and wondering why no one answers your CQ.
Frequently Asked Questions
What are the NOAA space weather scales?
NOAA publishes three space weather scales: R (Radio Blackout), S (Solar Radiation Storm), and G (Geomagnetic Storm). Each runs from 1 (minor) to 5 (extreme), with each step approximately 10× worse than the previous. The R scale is tied to solar flare X-ray class, the S scale to proton flux above 10 MeV, and the G scale to the planetary Kp index.
What is an R3 radio blackout?
An R3 event is triggered by an X1–X9 flare and causes a wide-area HF blackout primarily affecting 10–30 MHz on the sunlit hemisphere for approximately one hour. Low-frequency navigation signals are degraded. For amateur radio operators, R3 means 40m and 80m are essentially unusable on dayside paths, and 10m–20m are severely degraded.
What does a G3 geomagnetic storm mean for ham radio?
A G3 storm (Kp7) causes intermittent HF radio degradation on many paths globally, with blackout possible at high latitudes. 10m through 20m become unreliable for DX on polar-adjacent paths. 40m and 80m NVIS remain the most reliable for regional communication within 300–800 km radius. Aurora is visible at geomagnetic latitude ~50°, enabling 6m and 2m aurora scatter for suitably located operators.
What is an S3 solar radiation storm?
An S3 event (proton flux > 1,000 pfu at > 10 MeV) produces polar cap absorption that makes transpolar HF paths essentially unusable. Satellites may experience upsets. Polar air and sea routes see increased radiation exposure. The effect persists for 24–72 hours or longer as protons continue precipitating. Operators relying on transpolar paths should switch to long-path routing.
Can all three NOAA scales occur simultaneously?
Yes. A major solar event — an X-class flare with an associated CME and SEP event — can produce R4–R5, S3–S4, and G3–G5 conditions in sequence over 1–3 days. The October 2003 Halloween storms and the May 2024 G5 event both involved combined R, S, and G events. The operational response differs for each scale.
How does DXRadar track NOAA space weather scale events?
DXRadar displays current R, S, and G scale alert levels from NOAA SWPC in real time, alongside GOES X-ray flux and Kp index trends. The solar weather dashboard consolidates all three scales into a single view, with band-by-band propagation impact summaries that translate the scale levels into actionable operating guidance.