Operator's Verdict: SFI is 137 SFU, Kp is 0.33, and the current X-ray class is B7.2. For a full dashboard view, visit DXRadar Solar Weather.
What Space Weather Actually Is
Space weather is the collective term for variable conditions in near-Earth space caused by the Sun's output — electromagnetic radiation, energetic charged particles, and the continuous stream of plasma called the solar wind. For HF radio operators, space weather is not an abstract academic topic. It determines whether 15m is open to Europe this afternoon, whether 40m is being eaten by aurora tonight, and whether you should stay up for that rare DX entity on 10m or go to bed.
The Sun's output varies on timescales from seconds (solar flares) to years (solar cycle). Every variation has a different effect on the Earth's ionosphere — the shell of ionized gas between roughly 60 and 1,000 km altitude that reflects HF radio signals. Understanding the pipeline from Sun to ionosphere to radio path gives you a significant advantage over operators who rely on gut feel or luck.
NOAA's Space Weather Prediction Center (SWPC) provides the authoritative monitoring data. The DXRadar solar weather dashboard translates that data into the five key metrics every HF operator should understand.
Pro Tip: Bookmark the DXRadar solar weather dashboard for a one-glance view of SFI, Kp, X-ray flux, and solar wind speed — updated every 10 minutes from NOAA data. Checking it before every operating session takes 30 seconds and can save hours of dead-air frustration.
The Five Space Weather Metrics Every HF Operator Needs
1. Solar Flux Index (SFI)
SFI is your primary indicator of overall ionospheric quality and high-band openings. It measures the Sun's radio emission at 2800 MHz (10.7 cm wavelength) in Solar Flux Units (SFU), where 1 SFU = 10⁻²² W/m²/Hz. The Dominion Radio Astrophysical Observatory in Penticton, British Columbia, measures SFI three times daily.
The higher the SFI, the more UV and EUV the Sun is producing — and that UV/EUV is what ionizes the F2 layer. Higher F2 ionization raises the Maximum Usable Frequency, opening higher HF bands. The practical thresholds:
- SFI below 80: 10m and 12m are closed to F2. 15m is marginal. 20m and 40m are the working bands.
- SFI 80–120: 15m opens for DX during daytime. 10m shows F2 only on equatorial paths at equinox.
- SFI 120–150: 10m opens reliably during daylight from mid-latitudes. 15m and 12m are excellent.
- SFI 150+: All HF bands productive. 10m may be open worldwide for 6+ hours per day.
The F2 layer responds to SFI with a 24–48 hour lag — yesterday's high SFI is as important as today's. Follow the trend, not just the snapshot.
2. Kp (Planetary K-Index)
Kp measures geomagnetic field disturbance, which degrades high-latitude HF paths and drives aurora. It is averaged from 13 geomagnetic observatories and reported on a 0–9 scale every 3 hours. NOAA updates the estimated Kp continuously (NOAA SWPC Space Weather Scales).
Low Kp means stable HF conditions. High Kp means the auroral oval has expanded and its absorption is eating into paths that cross high latitudes. The operational thresholds:
| Kp | NOAA G-Scale | HF Impact |
|---|---|---|
| 0–2 | Quiet | Excellent. High-latitude paths fully usable. |
| 3–4 | Unsettled | Minor degradation on paths above 60°N. Watch the trend. |
| 5 | G1 Minor Storm | High-latitude paths (>55°N GC) degraded. Transpolar routes start failing. |
| 6 | G2 Moderate | Serious degradation on polar and transpolar paths. Arctic DX affected. |
| 7 | G3 Strong | HF disruption extends to paths crossing 50°N. Wide area impact. |
| 8–9 | G4–G5 | Widespread HF failure from the polar zone down to mid-latitudes. |
Kp 5 is the G1 storm threshold — NOAA's first official geomagnetic storm level. Most serious degradation begins at Kp 6–7. The May 2024 G5 (Kp 9) event took out 20m on high-latitude paths entirely while 40m NVIS remained usable for operators south of 45°N.
3. A-Index
The A-index is the daily average of geomagnetic activity — think of it as Kp integrated over 24 hours. It is calculated from eight 3-hour K-index measurements per day and expressed as a linear scale (unlike K, which is quasi-logarithmic). A-index of 0–7 = quiet; 8–15 = unsettled; 16–29 = active; 30–49 = minor storm; 50+ = major storm.
The A-index is most useful for post-event analysis and multi-day planning. A sustained A-index above 20 for several consecutive days indicates a geomagnetically disturbed period where planning around 40m NVIS makes more sense than chasing 10m DX. For real-time decisions, check Kp directly.
4. X-ray Flux Class
The current X-ray class tells you whether a solar flare is actively causing HF blackouts right now. GOES satellites monitor soft X-ray flux (0.1–0.8 nm) continuously. Flares are classified A, B, C, M, and X, each class being ten times more intense than the previous (NOAA SWPC, Solar Flare Classification).
For operational decisions:
- A and B class: No impact. Background level.
- C class: Negligible to minor on low-latitude paths below 10 MHz.
- M class (R1–R2): Low-band degradation on sunlit paths; M5+ affects 10–20 MHz.
- X class (R3–R5): Wide HF blackout on the entire dayside. X1+ = R3 alert.
The blackout hits only the sunlit hemisphere. If you are operating at night and see an M or X flare alert, your path is unaffected unless you are calling a station on the dayside.
Check the DXRadar X-ray chart for the 6-hour flux trend and any active flare events.
5. Solar Wind: Speed, Density, and Bz
Solar wind parameters — particularly Bz — are the leading indicator of a geomagnetic storm before it registers in Kp. The solar wind is a continuous stream of plasma from the Sun. Embedded in it is the interplanetary magnetic field (IMF), which has a north-south component called Bz.
When Bz turns southward (negative), it reconnects with Earth's magnetic field and allows solar wind energy to couple into the magnetosphere. A sustained Bz of -10 nT or more negative typically produces Kp 5+ within a few hours. During major CME arrivals, Bz can reach -30 nT or below, driving extreme geomagnetic storms.
Solar wind speed above 600 km/s (compared to typical ~400 km/s) indicates a fast CME shock arrival. When you see the DXRadar solar weather page showing high solar wind speed with southward Bz, a geomagnetic storm is in progress or imminent — adjust your operating plans accordingly.
The Sun-Earth Pipeline: Timing from Flare to Storm
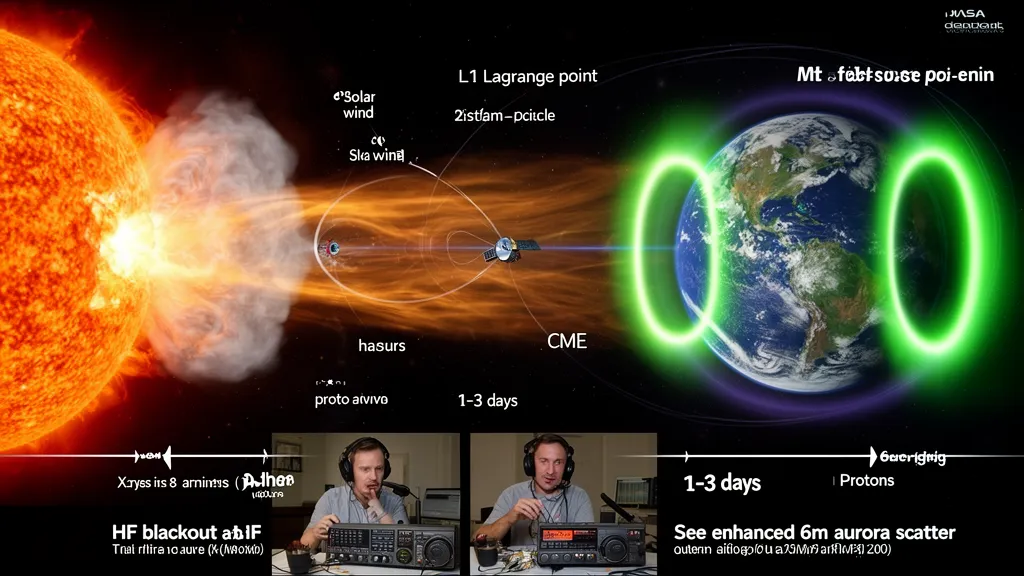
Understanding the timing of space weather events lets you make accurate predictions rather than reacting after the fact. The pipeline has three distinct stages:
Stage 1: X-ray Arrival (8 minutes)
A solar flare produces an immediate X-ray burst. X-rays travel at the speed of light and reach Earth in approximately 8 minutes. The moment a flare peaks, the D layer on the sunlit hemisphere is already ionizing. There is essentially zero warning time — the effect is simultaneous with the flare reaching its peak.
If you are monitoring the DXRadar X-ray chart and see the flux jump from B to M-class, the HF blackout on the dayside has already started. Check the current class and decide whether to wait out the recovery (typically 30–90 minutes for M-class, 1–3 hours for X-class) or operate on the dark hemisphere.
Stage 2: Proton Arrival (15 minutes to several hours)
Large solar flares and associated CMEs can accelerate protons to relativistic speeds. These energetic protons arrive 15 minutes to a few hours after the X-ray peak, funnelling into the polar regions along Earth's magnetic field lines. The result is polar cap absorption (PCA) — a severe degradation of HF on any path crossing the polar cap.
PCA events are distinct from geomagnetic storm effects. A PCA can start within an hour of a major X-class flare and persist for days. Transpolar routes (e.g., North America to Japan via the Arctic) become unusable. The NOAA S-scale (Solar Radiation Storm, S1–S5) measures energetic proton flux. An S1 event is enough to degrade polar paths; S3+ causes serious PCA across the polar cap.
Stage 3: CME Arrival (1 to 3 days)
A coronal mass ejection is a billion-tonne cloud of magnetized plasma ejected from the Sun at 400–2,000 km/s. Earth-directed CMEs typically arrive 1–3 days after the associated flare. When the CME shock reaches Earth, it compresses the magnetosphere and drives the geomagnetic storm measured by Kp and the Dst index.
The severity of the geomagnetic storm depends primarily on the southward Bz component of the CME's magnetic field. A CME with strong northward Bz may produce only minor disturbances. The same CME with strong southward Bz can drive a G4–G5 major storm. This is why CME storm predictions have uncertainty — we do not know the CME's internal field orientation until it reaches the L1 monitoring point (NOAA's DSCOVR satellite), about 30–60 minutes before it hits Earth.
That 30-to-60-minute window between DSCOVR detection and magnetospheric impact is when you see the DXRadar Bz indicator flip from neutral to strongly negative. When Bz goes to -15 nT and solar wind speed jumps to 700 km/s, you have under an hour before Kp begins rising rapidly.
How SFI and Kp Interact: Combined HF Impact
Neither SFI nor Kp alone tells the full story. A high SFI with a storm creates a different operating environment than a low SFI with quiet conditions. Here is how the combinations play out:
| SFI | Kp | HF Impact Summary |
|---|---|---|
| 180+ | 0–2 | Excellent. 10m open worldwide. All bands productive. |
| 180+ | 5–6 | Mixed. High-latitude paths fail. Mid-latitude 10m F2 may survive. |
| 180+ | 7+ | Serious. Mid-latitude high-band paths disrupted. 40m becomes workhorse. |
| 120–150 | 0–2 | Good. 10m and 15m productive during daylight at mid-latitudes. |
| 120–150 | 5–6 | Moderate impact. Focus on mid-latitude 20m and 17m paths. |
| 80–120 | 0–2 | Fair. 20m and 40m reliable. 10m closed to F2. |
| 80–120 | 5+ | Poor. High-band DX limited. 40m NVIS the best option. |
| Below 80 | 0–2 | Poor high bands. 40m and 80m reliable regionally. |
| Below 80 | 5+ | Very poor. Any HF DX is a long shot. |
The most productive operating window is high SFI + low Kp. This is not always predictable, but the Sun tends to have active regions that produce both high SFI and occasional flares — which can drive geomagnetic storms. Following the DXRadar solar weather dashboard lets you catch the windows between storms when high SFI and quiet geomagnetic conditions coincide.
The Practical Daily Workflow
For a focused HF operator, checking space weather before each session takes less than 60 seconds and can save hours of frustration or reveal opportunities you would otherwise miss.
Step 1: SFI. Open the DXRadar solar weather page and read the current SFI and its 24-hour trend. Is it above 120? Are you at solar maximum phase? This sets your band selection strategy.
Step 2: Kp. Check the current Kp and the 24-hour trend. Is it rising or falling? If Kp is above 5, avoid high-latitude paths and shift to mid-latitude 20m and 40m. If Kp is 0–2 and SFI is high, it is a go day for 10m and 15m DX.
Step 3: X-ray class. Glance at the current X-ray flux on the DXRadar X-ray chart. Is there an ongoing M or X flare? If yes, expect dayside blackout for another 30–90 minutes. If the flux is at A or B level, solar conditions are quiet and flares are not a current concern.
That three-step check takes 60 seconds and gives you an accurate picture of what the ionosphere is doing. The rest is operating skill.
Space Weather Resources on DXRadar
The DXRadar Solar Weather dashboard consolidates the key metrics:
- SFI trend (current value + 27-day history)
- Kp trend (current value + 24-hour history)
- X-ray flux chart (real-time GOES data)
- Aurora oval (NOAA OVATION model)
- Solar wind Bz (current IMF orientation)
- SDO solar imagery (latest EUV images)
The aurora page shows the live auroral oval position from the NOAA OVATION model — the same data that powers professional aurora forecasts. If you want to know whether a polar route will survive tonight, the auroral oval extent is the most direct visual indicator.
Frequently Asked Questions
What is space weather in simple terms?
Space weather is the Sun's variable output — including X-rays, energetic particles, and solar wind plasma — and its effects on Earth's near-space environment. For HF radio operators, it determines whether the ionosphere supports propagation, whether flares have caused blackouts, and whether geomagnetic storms have degraded high-latitude paths. The current space weather status is shown on the DXRadar solar dashboard.
How does space weather affect HF radio propagation?
Space weather affects HF through three mechanisms. Solar UV and EUV (tracked by SFI) ionize the F2 layer and raise the MUF, enabling higher-frequency bands. Solar flares (tracked by X-ray class) ionize the D layer and cause absorption-based blackouts on the dayside. Geomagnetic storms (tracked by Kp) distort and deplete the F2 layer at high latitudes, degrading polar and high-latitude paths.
What is the best space weather for ham radio?
The best HF conditions combine high SFI (above 150) with low Kp (below 3) and no ongoing X-ray events above C class. This combination means the F2 layer is strongly ionized, geomagnetic conditions are stable, and the D layer is not being enhanced. These conditions produce simultaneous openings on 10m, 12m, 15m, and 17m with signals running S9 or better on major DX paths.
What is the difference between K-index and A-index?
The K-index is a 3-hourly quasi-logarithmic measure of geomagnetic activity at a single station or averaged across 13 stations (Kp = planetary). It is the real-time operational metric. The A-index is a daily linear average derived from eight K-index measurements per day — it provides a smoother summary of the day's geomagnetic conditions. For real-time decisions, use Kp. For multi-day planning, use the A-index trend.
Does space weather affect FM and VHF?
Space weather generally does not disrupt VHF/UHF terrestrial propagation the way it affects HF. However, it creates opportunities: sporadic-E can produce unexpected VHF openings independent of space weather conditions, and auroral backscatter on 6m and 2m requires elevated Kp. High-latitude satellite links can experience scintillation during major geomagnetic storms (NASA Goddard). The primary operational impact of space weather is on the HF bands (3–30 MHz).
How accurate are space weather forecasts?
Short-term X-ray flux predictions (whether a flare will occur in the next few hours) have limited accuracy because active regions can flare unpredictably. CME transit time predictions are accurate to ±6 hours but storm intensity is uncertain until Bz is measured at L1. Kp forecasts for the next 24 hours are reasonably reliable when a CME arrival is confirmed. For radio operations, treat space weather forecasts as probabilities rather than certainties and monitor live data during critical operating periods.
For deeper reading, see What is the Solar Flux Index (SFI)?, Understanding the K-Index, and Solar Flare Effects on Ham Radio. Monitor all conditions live on the DXRadar Solar Weather dashboard.