Operator's Verdict: Check Bz on DXRadar's aurora page before any contest or DX session. If Bz has been negative for the past 2+ hours and Kp is climbing, HF disruption is already underway or imminent. Solar wind speed above 600 km/s combined with southward Bz is a reliable precursor to a moderate storm within hours.
The Solar Wind: A Continuous Particle Stream, Not a Wind
The solar wind is a continuous outflow of ionized plasma — primarily protons (~96%) and electrons (~4%), with trace heavier ions — streaming outward from the Sun's corona in all directions at speeds of 300–800 km/s under normal conditions (NOAA SWPC Real-Time Solar Wind documentation). It is not a wind in any atmospheric sense; it is a magnetized plasma that carries embedded magnetic field lines anchored back to the Sun.
At Earth's orbital distance (~1 AU = 150 million km), the solar wind has:
- Speed: 300–800 km/s (ambient), up to 2,500 km/s during CME passage
- Proton density: typically 5–15 protons per cm³
- Temperature: ~100,000 K (proton), ~130,000 K (electron)
- Embedded magnetic field (IMF): ~5–10 nT amplitude under quiet conditions
This stream is permanent — it exists throughout the solar cycle. Unlike a CME, which is a discrete explosive event, the solar wind blows continuously day and night. What changes is its speed, density, temperature, and magnetic field orientation. Those variations are what drive geomagnetic activity.
The distinction between solar wind and CMEs matters for operators: a CME arrival is a discrete event followed by recovery, while coronal hole streams (described below) produce recurrent geomagnetic disturbances on a ~27-day cycle matching the Sun's rotation period. During solar minimum, coronal hole activity often dominates over CMEs as the primary source of geomagnetic storms.
Slow Stream vs. Fast Stream: Where the Solar Wind Comes From
The solar corona does not emit solar wind uniformly. Two distinctly different wind regimes originate from two different source regions:
Slow solar wind (300–400 km/s): Emerges from the equatorial belt around active regions and helmet streamers — the bright arch-like structures seen in white-light coronagraph images. Slow wind is denser (~10–15 p/cm³) and more variable in composition. It is the background solar wind during quiet periods. Its associated Bz tends to be irregular and oscillates between northward and southward on timescales of minutes to hours, making geomagnetic activity from slow wind streams relatively unpredictable.
Fast solar wind (600–800 km/s): Originates from coronal holes — regions of open, unipolar magnetic field where solar wind particles can escape freely. In EUV and soft X-ray imagery (e.g., SDO AIA 193 Å), coronal holes appear distinctly darker than surrounding regions because they are cooler and less dense. Fast wind streams are less dense (~3–5 p/cm³) but carry more kinetic energy. Equatorial-facing coronal holes are the most geoeffective because they project their streams along the Sun-Earth line.
Coronal holes are semi-permanent structures on timescales of weeks to months. A large equatorial coronal hole can produce recurrent geomagnetic disturbances every ~27 days as it rotates back into a favorable position. Amateur radio operators experienced with solar cycles learn to track these: if a coronal hole produced unsettled conditions this rotation, mark your calendar for 27 days hence.
Corotating Interaction Regions: The Moderate-Storm Factory
When a fast solar wind stream catches up with preceding slow stream plasma, the two streams interact. The boundary region — where fast wind compresses the slow wind ahead of it — is called a Corotating Interaction Region (CIR). CIRs are:
- Regions of enhanced plasma density and magnetic field strength
- Associated with compressed, often southward-oriented Bz
- Capable of producing G1–G2 geomagnetic storms without any CME or flare
- Predictable: they co-rotate with the Sun at the same ~27-day period as their parent coronal hole
CIR-driven storms differ from CME storms in character. CME storms can be more intense (G3–G5) but are episodic. CIR storms are more predictable in timing and typically cap out at G2–G3. During the declining phase of the solar cycle — roughly 2–4 years after solar maximum — CIR activity often dominates over CMEs as the primary source of geomagnetic disturbance. Solar Cycle 23's declining phase (2004–2008) was a textbook example, with recurrent coronal hole streams producing persistent G1–G2 activity that kept high-latitude 10m DX paths unreliable for extended periods.
Key Parameters: What DXRadar Displays from DSCOVR
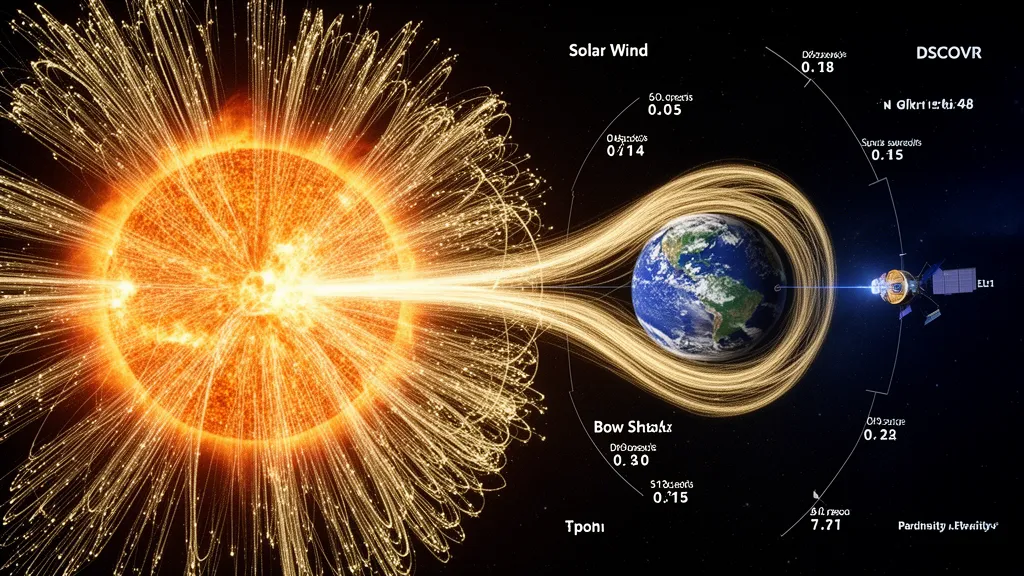
NOAA's DSCOVR spacecraft at the L1 Lagrange point — 1.5 million km sunward of Earth — continuously measures the solar wind 15–60 minutes before it reaches Earth (depending on speed). DXRadar's solar weather pages display the critical parameters in real time.
Solar wind speed (km/s): The raw velocity of the plasma stream. Below 400 km/s = quiet. 400–600 km/s = moderate; watch Bz. Above 600 km/s = elevated; if Bz is also southward, storm conditions likely.
Proton density (p/cm³): Higher density means more particles hitting the magnetosphere per unit time. Density spikes often accompany CME sheath regions or CIR boundaries. A sudden rise in density alongside a speed jump is a common signature of CME shock arrival.
Bz (nT): The north-south component of the IMF. This is the single most important parameter for predicting geomagnetic storm impact. Negative = southward = geoeffective. Positive = northward = generally benign. All other solar wind parameters are secondary to Bz.
Proton temperature (K): Less commonly displayed but useful — anomalously hot protons relative to expected temperature at a given speed are a signature of CME magnetic cloud passage, which can help distinguish CMEs from CIRs in the data.
How Bz Drives Geomagnetic Storms — and HF Disruption
The mechanism by which southward Bz drives geomagnetic storms involves magnetic reconnection at Earth's dayside magnetopause. Under normal conditions, Earth's northward-pointing magnetospheric field lines and the predominantly northward IMF are antiparallel at the magnetopause boundary — they do not easily connect. When the IMF turns southward, field lines on opposite sides of the magnetopause become parallel: conditions favor reconnection, which transfers solar wind energy and momentum into the magnetosphere.
This energy injection:
- Accelerates particles into the ring current — a toroidal electrical current around Earth at ~3–6 Earth radii
- Drives substorm activity in the polar regions — producing aurora and particle precipitation
- Distorts the magnetospheric shape — compressing the dayside and stretching the nightside tail
- Ionizes the high-latitude ionosphere — enhancing and disrupting F2 propagation simultaneously
The HF consequences are proportional to Bz magnitude and duration:
| Bz (nT) | Duration | Probable Storm Level | Typical HF Impact |
|---|---|---|---|
| −3 to −5 | Hours | Unsettled to G1 | Minor degradation above 60°N |
| −5 to −10 | 1–2 hours | G1–G2 | High-latitude F2 paths degraded |
| −10 to −15 | 1+ hours | G2–G3 | 15m and above unreliable poleward of 55°N |
| −15 to −25 | 30+ min | G3–G4 | 20m disrupted at high latitudes; aurora VHF possible |
| Below −25 | 30+ min | G4–G5 | Wide HF degradation; low-latitude paths affected |
Crucially, Bz fluctuates rapidly. A southward dip to −15 nT lasting only 5 minutes rarely produces sustained storm conditions. It is the sustained southward Bz — held for 30 minutes or more — that allows the ring current to build to storm levels. This is why monitoring the Bz trend for the past 1–2 hours (available on DXRadar's aurora page) is more useful than looking at the instantaneous value.
Seasonal Solar Wind Effects: The Russell-McPherron Effect
Geomagnetic storm frequency is not uniform through the year. It peaks near the March and September equinoxes — a pattern that has puzzled and fascinated space physicists since the early satellite era. The explanation is the Russell-McPherron effect (identified by C.T. Russell and R.L. McPherron in 1973).
The Parker spiral — the curved path the IMF follows as it is carried outward by solar wind while the Sun rotates — has a specific orientation relative to Earth's magnetic field that varies with season. At equinoxes, the geometry of the Sun-Earth-IMF alignment is such that even a nominally weak or northward IMF has a larger southward component in geocentric solar magnetospheric (GSM) coordinates than it does at solstices. In effect, the equinox geometry makes the magnetosphere more vulnerable to coupling with any given Bz value.
The practical result: mid-latitude HF operators should expect more frequent G1–G2 geomagnetic disturbances in March and September even during moderate solar activity. Conversely, December and June tend to be quieter, all else being equal.
Before a DX contest, check the Bz trend for the past 6 hours on DXRadar. If Bz has been consistently negative and Kp is above 3 and rising, expect HF disruption on high-latitude paths. If Bz is near zero or positive and solar wind speed is under 500 km/s, conditions are likely stable for the next several hours. This 5-second check has saved many contest weekends.
Coronal Holes and 27-Day Recurrence: Planning Around the Solar Rotation
Large equatorial coronal holes can dominate the space weather picture for weeks to months. During the declining phase of the solar cycle, coronal holes expand toward the equator and produce fast-stream impacts on a regular 27-day cadence.
The operational benefit: once you identify a coronal hole impact (G1–G2 storm, elevated solar wind speed above 600 km/s, no associated flare), you can predict a repeat approximately 27 days later. The NOAA SWPC 27-day outlook product attempts to codify this by forecasting geomagnetic activity based on observed activity in the previous solar rotation.
For POTA activations, contest planning, or DXpedition timing, this recurrence pattern means that a bad propagation weekend caused by a coronal hole stream is not random — it was predictable and the next occurrence is similarly predictable. Mark the date, check the SDO 193 Å imagery for coronal hole evolution, and plan accordingly.
Reading Solar Wind Data on DXRadar
DXRadar's aurora page displays real-time DSCOVR-sourced data updated as NOAA refreshes the feed (typically every 1 minute). The key displays to interpret:
Bz gauge: Shows current Bz in nT. The color coding and orientation indicate northward (typically green/blue = benign) or southward (typically red = watch for storm). The trend line for the past 1–2 hours is more informative than the instantaneous value.
Solar wind speed bar: Current speed in km/s. Thresholds: below 400 (quiet), 400–550 (moderate), above 550 (elevated — check Bz immediately).
Kp index: The planetary geomagnetic activity index. Computed from magnetometer networks globally, updated every 3 hours. Lags real-time Bz by up to 3 hours, but reflects actual storm intensity at Earth's surface.
The interplay of these three — Bz, speed, Kp — gives you the complete picture. A speed jump to 650 km/s with Bz at +3 nT and Kp at 2 means a fast-stream arrival that has not (yet) driven a storm. The same speed with Bz at −12 nT and Kp already at 5 means the storm is in progress and worsening. Those two situations have completely different implications for a 20m opening to Japan.
Frequently Asked Questions
What is the solar wind and how does it affect ham radio?
The solar wind is a continuous stream of charged particles — primarily protons and electrons — flowing outward from the Sun's corona at 300–800 km/s. When the embedded magnetic field (Bz) turns southward, it couples with Earth's magnetosphere and drives geomagnetic storms that degrade HF propagation at high and mid-latitudes.
What is Bz in solar wind data?
Bz is the north-south component of the interplanetary magnetic field (IMF) carried by the solar wind. When Bz is negative (southward), energy flows into Earth's magnetosphere through magnetic reconnection, raising the Kp index and disrupting HF propagation. Sustained Bz below −10 nT for 1+ hours typically produces at least a G2 geomagnetic storm.
What is a coronal hole and why does it matter for propagation?
A coronal hole is an open magnetic field region in the Sun's corona visible as a dark area in EUV/X-ray imagery. Coronal holes emit fast solar wind streams at 600–800 km/s. When a coronal hole stream reaches Earth, it can produce G1–G2 geomagnetic storms via corotating interaction regions (CIRs), even without any solar flare or CME.
How fast does solar wind travel?
Slow solar wind from active regions travels at roughly 300–400 km/s. Fast wind from coronal holes travels at 600–800 km/s. CMEs, which are discrete ejections rather than steady-state flow, can exceed 2,000 km/s. At 400 km/s, solar wind takes about 4 days to travel from the Sun to Earth.
Does high solar wind speed alone degrade HF propagation?
Not necessarily. Solar wind speed by itself has limited direct impact on HF propagation. The critical variable is Bz — the north-south orientation of the embedded magnetic field. A fast solar wind stream with northward Bz can pass Earth with minimal geomagnetic activity. The same speed with southward Bz can drive a G3 storm.