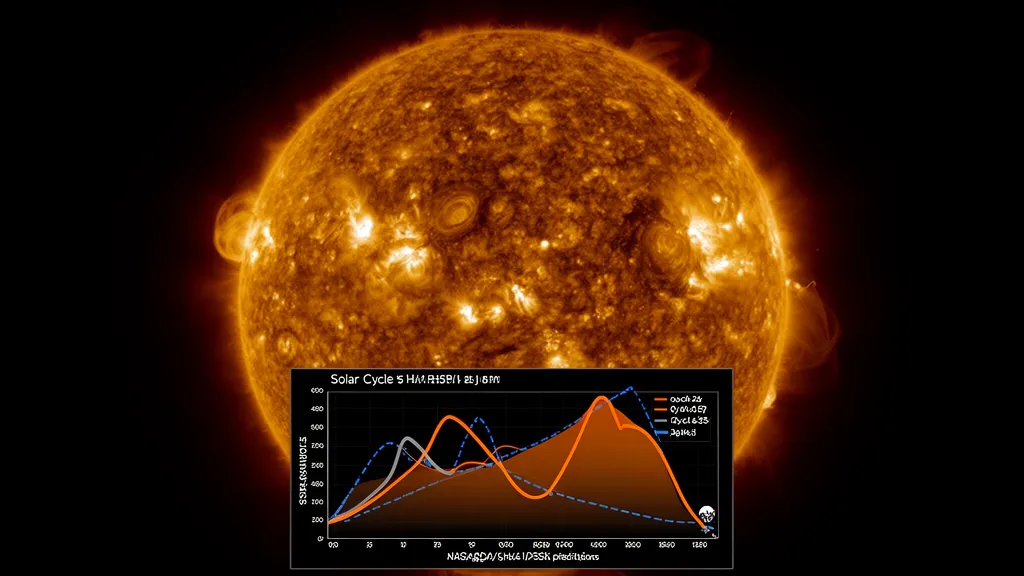
Operator's Verdict: Solar Cycle 25 is at or near peak. The current SFI is 104 and SSN is tracking well above the NOAA/NASA 2019 forecast. The 10-meter band is open daily to multiple continents. Work DX on 10m and 12m now — this window will not return for approximately a decade.
What Is a Solar Cycle?
A solar cycle is an approximately 11-year cycle of solar magnetic activity that runs from one sunspot minimum through a maximum and back to the next minimum. Cycles are numbered sequentially from Cycle 1 (beginning around 1755). Solar Cycle 25 began in December 2019, defined as the official minimum by the NOAA/NASA Solar Cycle 25 Prediction Panel based on the lowest smoothed monthly sunspot number of that solar minimum.
The driving mechanism is the Sun's magnetic dynamo. During minimum, the Sun's magnetic field is relatively organized, with few sunspot groups. As the cycle progresses, the magnetic field becomes increasingly tangled. Sunspot groups — cooler, magnetically intense regions on the solar surface — appear more frequently and at lower latitudes (following Spörer's Law, which is visible as the "butterfly diagram" of sunspot latitudes over time). At maximum, the field complexity peaks: sunspots are numerous, solar flares are frequent, and the Sun's polar magnetic field reverses polarity. Then the field gradually settles toward the next minimum configuration.
For HF radio operators, the solar cycle is the dominant driver of decade-scale band conditions. During solar minimum, the higher HF bands close — 10m, 12m, and 15m may support only sporadic-E and transequatorial propagation (TEP) rather than reliable F2 DX. During solar maximum, the Maximum Usable Frequency (MUF) rises across all propagation paths, opening those bands to worldwide F2 DX for years at a time.
The 2019 Prediction — and Why It Was Wrong
The NOAA/NASA Solar Cycle 25 Prediction Panel, convened in 2019 with representatives from multiple institutions, produced what became one of the most significantly underestimated solar cycle forecasts in modern space weather history.
The panel's consensus prediction was a smoothed maximum of 115, peaking around July 2025, with an expected range of roughly 105–125. That forecast reflected the then-prevailing view that Cycle 25 would resemble the weak Cycle 24, which peaked at a smoothed SSN of only 116. Some panel members advocated for a stronger cycle, but the consensus remained conservative.
What actually happened was substantially different. By early 2024, monthly SSN values were regularly exceeding 150. By mid-2024, smoothed SSN values were tracking well above the panel's upper bound. By late 2024, SSN exceeded 200 on multiple months — comfortably above the 90th percentile of the Cycle 25 prediction envelope. The cycle had arrived earlier and stronger than essentially any institutional forecast.
As of March 2026, Solar Cycle 25 is tracking above the 90th percentile of the NOAA Cycle 25 prediction (NOAA SWPC Solar Cycle Progression data). The SFI is frequently above 200 SFU — a level not sustained during Cycle 24 at all. This is the context in which current HF band conditions should be understood: we are at or near a historically strong solar maximum, not a modest one.
The science of solar cycle prediction is genuinely difficult. The Sun's magnetic dynamo operates on processes that are not yet fully predictable from precursor measurements. The Cycle 25 miss is not a failure of method — it is a reflection of the inherent uncertainty in forecasting a chaotic system 6 years into the future.
Historical Context: How Cycle 25 Compares
Solar cycles are compared using their smoothed monthly International Sunspot Number (ISN), maintained by the Royal Observatory of Belgium (WDC-SILSO). The historical record goes back to 1755.
| Solar Cycle | Approximate Peak SSN | Peak Year | Notes |
|---|---|---|---|
| Cycle 19 | ~285 | 1958 | Strongest cycle on record — extraordinary 10m DX conditions |
| Cycle 21 | ~233 | 1980 | Very strong; excellent HF conditions |
| Cycle 22 | ~213 | 1989 | Strong; notable March 1989 G5 storm |
| Cycle 23 | ~181 | 2000 | Moderate-to-strong; Halloween storms 2003 near end of cycle |
| Cycle 24 | ~116 | 2014 | Weakest in ~100 years; poor 10m conditions |
| Cycle 25 | 200+ (tracking) | ~2024–2025 | Well above predictions — among strongest in modern era |
The comparison with Cycle 24 is the most operationally relevant for today's operators. At the Cycle 24 maximum (SSN ~116) in 2014, 10m would open for 2–3 hours on favorable days, primarily on short east-west paths within the same latitude band. At the Cycle 25 peak, operators at mid-latitude QTHs routinely report 10m open for 8–10 hours simultaneously to Europe, South America, Asia, and Oceania — all continents on the air at once.
The comparison with Cycle 19 (the strongest on record, SSN ~285 in 1958) puts Cycle 25 in perspective. Cycle 25 is strong but not unprecedented. Operators active in the late 1950s described conditions that today would seem extraordinary: 10m contacts from the US to Australia on 5 watts with voice, simultaneous contact with dozens of DXCC entities in a single session on 10m. Cycle 25 is approaching that territory, though Cycle 19 remains the benchmark.
Pro Tip: The DXRadar Solar Cycle 25 tracker shows live SSN, smoothed monthly values plotted against the NOAA prediction envelope, and the current SFI trend over the past 30 days. Compare the live SFI reading against the historical cycle curve to see exactly where Cycle 25 stands relative to past maxima.
How Solar Maximum Opens the HF Bands
The physical link between solar activity and HF propagation runs through the F2 layer of the ionosphere (approximately 200–400 km altitude). The F2 layer is sustained by UV and EUV radiation from the Sun, which ionizes oxygen and nitrogen atoms to produce free electrons. More solar activity → more ionizing radiation → higher F2 electron density → higher foF2 (critical frequency of the F2 layer) → higher MUF across all paths.
The Maximum Usable Frequency (MUF) for a single-hop F2 path is approximately MUF ≈ foF2 × sec(θ), where θ is the zenith angle at the ionospheric reflection point (ITU-R P.1240-2). In plain terms: the higher the foF2, the higher the frequency that can be reflected rather than passing through the ionosphere into space.
During solar minimum, foF2 at mid-latitudes in daylight might be 5–8 MHz. The corresponding MUF for a 3,000 km path (sec θ ≈ 3.5) is roughly 18–28 MHz. On 10m (28 MHz), the path is borderline or impossible via F2. During Cycle 25 peak conditions, foF2 at the same latitude and time can reach 12–16 MHz, pushing the MUF to 42–56 MHz — well above 10m, opening 10m to F2 DX and pushing the MUF into the VHF range.
Band-by-band effect at solar maximum:
| Band | Frequency | Solar Min Behavior | Solar Max (Cycle 25 peak) |
|---|---|---|---|
| 160m | 1.8–2.0 MHz | D-layer absorption limits to nighttime NVIS | Same — D-layer still present. No change. |
| 80m | 3.5–4.0 MHz | Regional NVIS day/night; limited DX | Slightly improved D-layer recovery; marginal improvement |
| 40m | 7.0–7.3 MHz | Reliable worldwide; 24/7 propagation | Same reliability; F2 MUF pushes above 40m even in marginal conditions |
| 30m | 10.1–10.15 MHz | Nearly always open for DX | Extremely reliable; excellent DX path fidelity |
| 20m | 14.0–14.35 MHz | Primary DX band; open most of the day | 24/7 with very high reliability and signal strengths |
| 17m | 18.068–18.168 MHz | Open most daylight hours | Near-24/7; excellent DX; sometimes works overnight |
| 15m | 21.0–21.45 MHz | Limited; closes at solar min | Long-duration openings; often 10+ hours daily |
| 12m | 24.89–24.99 MHz | Rarely open; sporadic-E only | Frequently open for F2 DX; excellent signals |
| 10m | 28–29.7 MHz | Minimal F2; mainly Es/TEP | Open for 8–12 hours daily to multiple continents |
Note: 10m spans 28.0–29.7 MHz worldwide, but permitted modes and power limits vary by ITU Region and national license class. Verify your allocations before transmitting.
The MUF, the FOT, and Operating at the Right Frequency
Understanding which frequency to actually use requires one more concept. The MUF is the theoretical upper limit — the highest frequency that can be reflected off the F2 layer on a given path. But operating right at the MUF is unreliable: small variations in ionospheric density cause the path to drop out intermittently.
The practical operating frequency is the Frequency of Optimum Traffic (FOT), which is approximately 80–90% of the MUF. This is the range where F2 propagation is stable and reliable, not just intermittently usable. During Cycle 25 peak conditions with MUF on a 10,000 km path reaching 50–55 MHz, the FOT falls at 40–50 MHz — meaning 10m is solidly in the FOT, not at the MUF edge. This is why 10m contacts during Cycle 25 peak sound so different from Cycle 24: strong, stable signals rather than the fading flutter of near-MUF propagation.
Gray Line and Extended Propagation Windows
The gray line — the terminator boundary between Earth's daylit and night hemispheres — creates brief propagation enhancement windows on lower HF bands (primarily 80m, 60m, and 40m) at sunrise and sunset. During solar maximum, the gray line effect interacts with elevated F2 conditions to extend propagation windows.
During Cycle 25 peak, gray line effects on 40m and 80m are more pronounced for two reasons:
First, the higher foF2 means the F2 layer remains ionized later into the evening before recombination brings it down. Morning opening on 40m DX begins earlier as the F2 layer builds faster under stronger UV flux. Second, the elevated background ionosphere means that even sub-optimal gray line geometries can support DX contacts. During Cycle 24 minimum, you needed near-perfect gray line alignment for a 40m contact over the pole — during Cycle 25 peak, that same path may work for 30–45 minutes around the gray line rather than the 5–10 minute window of solar minimum.
For operators pursuing DX on 40m and 80m, the practical implication is to extend your gray line monitoring window by 20–30 minutes in each direction compared to what solar cycle minimum experience would suggest.
POTA and QRP Operations at Solar Maximum
For Parks on the Air (POTA) operators running QRP power (typically 5–10W), Solar Cycle 25 peak conditions represent a generational opportunity. The path loss budget that limits QRP operation is partially offset by higher F2 MUF and increased ionospheric electron density, which improves signal-to-noise ratios on F2 paths.
What solar maximum makes possible for QRP:
At the Cycle 24 maximum (SSN ~116), a 5W station on 10m from the continental US might work Europe on a good day, with S3–S5 signal reports and significant fading. At Cycle 25 peak conditions, the same 5W station running 10m NVIS or short-path F2 paths to Europe reports consistent S7–S9 contacts — in SSB, not just FT8. The signal link budget advantage of solar maximum is equivalent to adding 1–2 S-units of apparent signal strength, or approximately 6–12 dB of effective path improvement on F2 routes.
QRP activators on 10m and 12m during Cycle 25 peak conditions regularly achieve 10+ contacts per hour, including DXCC entities that would have required full power during Cycle 24. 15m NVIS at QRP power becomes viable for regional POTA contacts out to 1,000–2,000 km during daylight hours. The DXRadar POTA map integrates live band conditions with activator spots — check current 10m opening status before choosing your operating frequency for an activation.
A practical field example: during a 2-hour POTA activation from a mid-latitude park (approximately 40° N) in late 2024, a 5W FT-891 with a portable vertical worked 23 DXCC entities on 10m in a single session — including JA, VK, ZL, EU, and SA contacts — all on 5W SSB. That same activation during Cycle 24 minimum (2018–2019) would have required 100W and likely yielded only domestic contacts.
Pro Tip: Before any field activation, check the live band status on DXRadar to see which bands have active PSKReporter spots on your target paths. During Cycle 25 peak conditions, 10m and 12m are frequently the best choices for QRP DX — but real-time spot data tells you if a band is actually open to your target region right now, not just theoretically possible.
What Comes After the Peak: The Descent Phase
Solar cycles descend more slowly than they rise. The ascent from Cycle 25 minimum (December 2019) to peak took approximately 4–5 years. The descent back to Cycle 26 minimum will likely take 5–7 years. That means the current solar maximum conditions are not a short window — they extend across a period of years.
But the descent is real, and operators who plan ahead will make the most of the remaining peak window.
What to expect during the descent from Cycle 25 maximum:
The first sign of descent is usually a reduction in the highest SSN monthly values. The smoothed curve turns downward. SFI values above 200 become less frequent, then rare. 10m openings shorten — from 10 hours daily to 6, then 4, then 2. By the time SSN drops back to 80–100 (roughly 2028–2030 if the cycle follows historical norms), 10m will once again be primarily a sporadic-E and TEP band rather than a reliable F2 DX band.
Band transition sequence during descent:
- 10m and 12m close first — their high frequency requires the highest MUF, which fails first
- 15m and 17m close next for reliable daily worldwide DX
- 20m remains the primary DX band throughout — it works under nearly all conditions
- 40m and 80m become workhorses again — operators who neglected these bands during peak conditions will rediscover their value
- 160m was never significantly affected by the cycle — it remains a specialized band regardless of solar phase
For operators who built their station primarily for 10m DX during Cycle 25, the descent phase is the time to diversify. A low dipole for 40m or 80m, useful year-round but especially valuable at solar minimum, is a sound investment to make while 10m is still reliable enough to motivate the work.
Frequently Asked Questions
When is solar cycle 25 peak?
According to NOAA and NASA tracking, Solar Cycle 25 reached its peak activity in late 2024 to early 2025, significantly earlier and stronger than the 2019 prediction panel's central forecast of a smoothed SSN of 115 around July 2025. As of early 2026, the cycle remains near peak with SFI frequently above 200 and SSN tracking well above the original panel envelope. The exact calendar month of maximum will be determined retrospectively from the international sunspot number record maintained by the Royal Observatory of Belgium (WDC-SILSO).
How does solar maximum affect ham radio?
During solar maximum, the Solar Flux Index (SFI) and sunspot number (SSN) are at their highest, raising the Maximum Usable Frequency (MUF) on all HF propagation paths. The higher HF bands — 10m, 12m, and 15m — open for long-duration F2 DX contacts that are impossible during solar minimum. QRP operators can work DXCC entities on 10m that required full power just five years earlier. All HF bands see improved conditions, with 20m reliable 24/7 and even 40m DX paths opening to new regions during the peak.
What is the sunspot number?
The sunspot number (SSN), formally the International Sunspot Number (ISN), is a daily index of the number of sunspot groups and individual spots visible on the solar disk, maintained by the Royal Observatory of Belgium (WDC-SILSO). SSN correlates directly with solar activity: higher SSN means greater UV and EUV flux from the Sun, which increases ionization of the F2 layer and raises the MUF across all HF propagation paths. Values range from near 0 at solar minimum to above 200 at strong solar maxima like Cycle 25.
Is 10m open during solar maximum?
Yes. During Solar Cycle 25 peak conditions, the 10-meter band (28–29.7 MHz worldwide, check your national allocations for permitted modes and power limits) opens via F2 propagation for 8–12 hours per day on many paths, with all continents simultaneously workable from mid-latitude QTHs. This is dramatically better than Solar Cycle 24 minimum conditions when 10m might open briefly to one region on good days. Check live 10m conditions on DXRadar to see current propagation status with real PSKReporter spot data.
How many years does a solar cycle last?
A solar cycle averages approximately 11 years from minimum to minimum, though individual cycles have ranged from 9 to 14 years (based on WDC-SILSO historical data going back to 1755). The cycle runs from solar minimum (fewest sunspots) through solar maximum (most sunspots) and back to minimum. The rise from minimum to maximum typically takes 4–5 years; the descent from maximum to the next minimum typically takes 5–7 years and proceeds more gradually than the rise phase.
Solar Cycle 25 tracking data on DXRadar is sourced from NOAA SWPC real-time feeds and the WDC-SILSO international sunspot number. Current SFI is 104. For live band conditions during this solar maximum, visit the DXRadar solar weather dashboard or check which bands are open right now. For an explanation of how individual solar events like flares affect your radio, see Solar Flare Effects on Ham Radio.