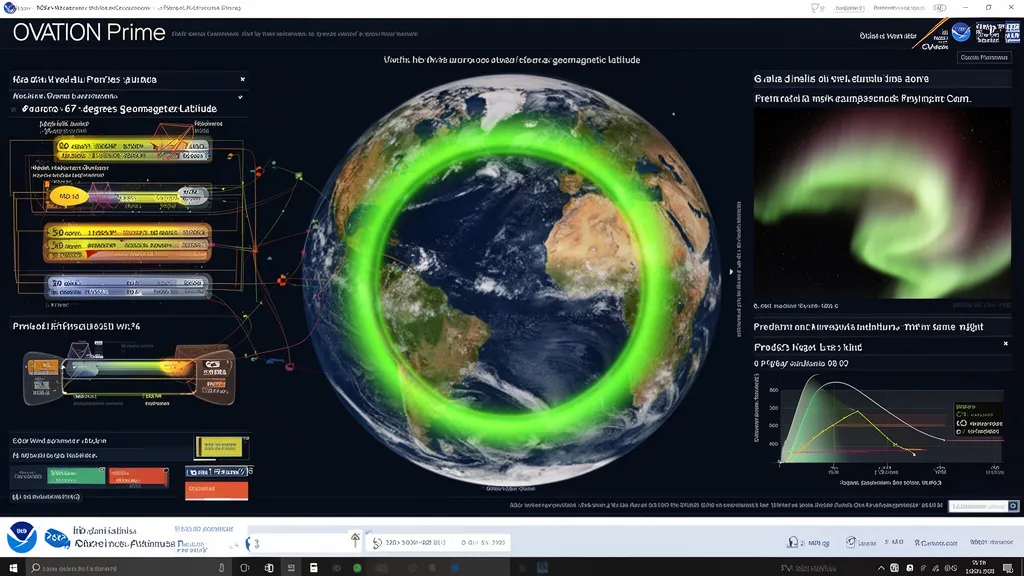
Operator's Verdict: The current K-index is 0.33. The live OVATION aurora map updates every minute using DSCOVR solar wind data. When the probability oval extends to your latitude and Bz is negative, aurora scatter on 6m is viable — point your beam north and check 50.313 MHz FT8.
What OVATION Is and Where It Comes From
OVATION — Oval Variation, Assessment, Tracking, Intensity, and Online Nowcasting — is NOAA's operational aurora prediction model. It was developed jointly by NOAA's Space Weather Prediction Center and the Applied Physics Laboratory at Johns Hopkins University. The current operational version, OVATION Prime-2013, was published by Newell et al. in Space Weather (2014) and is the same model underlying the aurora forecast product at NOAA SWPC.
The fundamental insight behind OVATION is empirical rather than purely first-principles physics. The model is built on a 20-year archive of satellite auroral measurements collected by the DMSP (Defense Meteorological Satellite Program) spacecraft. These satellites, in low polar orbit, carried particle detectors that measured energetic electron and ion precipitation across the auroral zones from the 1980s through the 2000s.
From this archive, Newell and colleagues derived statistical relationships between solar wind conditions — specifically, the solar wind coupling function (a composite of speed, density, and IMF orientation) — and auroral energy flux at each magnetic latitude and local time. OVATION is essentially a lookup into this database, conditioned on current solar wind parameters, producing a probabilistic forecast of aurora intensity at every point on the polar map.
The model does not simulate the physical processes in real time. It matches current solar wind conditions to the historical distribution of what the aurora did under similar conditions. This means it is fast, reliable under typical solar wind conditions, and well-validated — but it can be surprised by atypical events that fall outside the training distribution.
How DSCOVR Feeds OVATION in Real Time
DSCOVR (Deep Space Climate Observatory) is the primary operational solar wind monitoring spacecraft, positioned at the L1 Lagrange point approximately 1.5 million km sunward of Earth. At this gravitationally stable location, the spacecraft orbits while the solar wind streams past it continuously, carrying measurements about the interplanetary magnetic field and plasma conditions heading toward Earth.
DSCOVR's instruments measure:
- Solar wind speed (typically 300–800 km/s under normal conditions)
- Solar wind proton density (1–20 particles/cm³ typically)
- IMF Bz — the north-south component of the interplanetary magnetic field, the single most important parameter for geomagnetic activity
- IMF By — the east-west component, which contributes to dawn-dusk asymmetry in the auroral oval
These measurements are transmitted to the ground and published by NOAA in near-real-time. The data has a latency of roughly 1–5 minutes from measurement to publication. Once published, it takes NOAA's systems another few minutes to run OVATION and publish updated aurora probability maps.
The total latency from solar wind condition to OVATION map update is approximately 5–15 minutes under normal circumstances. However, there is a more fundamental latency that cannot be reduced: the travel time from L1 to Earth. The solar wind covers the 1.5 million km gap in roughly 15–60 minutes depending on solar wind speed (at 400 km/s, transit time is about 63 minutes; at 800 km/s, about 31 minutes).
This means the OVATION forecast is actually a nowcast of conditions that will arrive at Earth in the next 15–60 minutes based on what DSCOVR measured a few minutes ago. You are not seeing what is happening in Earth's magnetosphere right now — you are seeing what will arrive shortly. This is more useful than it sounds, because it gives operators time to act.
Pro Tip: When DSCOVR shows Bz suddenly turning strongly negative (below −10 nT) on the DXRadar solar weather dashboard, the geomagnetic storm impact is 30–60 minutes away. Use that window to set up your 6m station, check the aurora map, and get to a dark site if you want visual observation.
The OVATION Output: Reading the Probability Map
OVATION's output is an aurora energy flux map expressed as a probability of visible aurora at each geographic latitude and longitude. NOAA publishes this as a JSON endpoint (fetched by DXRadar), and it is rendered as a color overlay on the aurora map.
The probability values represent the model's estimate of the likelihood that a ground observer at that location, under clear dark skies, would see aurora. The color coding used by NOAA SWPC (and DXRadar) is:
| Color | Probability Range | Meaning for Ground Observer |
|---|---|---|
| Gray | 0% | No auroral precipitation expected |
| Green | 1–30% | Faint aurora possible; overhead or near northern horizon |
| Yellow | 30–60% | Moderate aurora likely; overhead curtains visible |
| Orange | 60–80% | Active aurora; bright bands and rays overhead |
| Red | 80–100%+ | Bright, active aurora near-certain; visible even with modest light pollution |
The red region typically corresponds to the auroral oval itself — the zone of maximum precipitation. For radio operators, the equatorward boundary of the green region is the more useful threshold. When that boundary reaches within 5–10 degrees of your geomagnetic latitude, 6m aurora scatter becomes viable even before the oval is directly overhead.
Ham radio operating note: Aurora scatter does not require the auroral oval to be directly overhead. The geometry works as long as the oval is roughly within 10–15 degrees of geomagnetic latitude of your QTH — because the scatter volume at 100–120 km altitude subtends a usable angle from long distances. A station at 50° N can work aurora scatter into a station at 55° N both beaming toward an oval whose equatorward boundary is at 58° N.
The Kp–OVATION Relationship: Why They Differ
OVATION and Kp measure related but distinct things. Kp is a geomagnetic activity index derived from 13 ground-based magnetometer stations worldwide, averaged over three-hour periods and converted to the 0–9 scale. It measures the disturbance in Earth's surface magnetic field caused by magnetospheric currents.
OVATION uses the solar wind directly, before it couples into the magnetosphere. The two can diverge significantly:
- During a sudden commencement (shock arrival), OVATION responds immediately to the new solar wind conditions, but Kp will not reflect the change until the next 3-hour averaging period completes.
- During a complex storm with multiple phases, OVATION can show the oval retreating while Kp is still high (because Kp is averaging over the recent past).
- At high latitudes, OVATION provides more spatial detail than Kp. Kp tells you the global intensity but not whether the oval is currently over Finland or over Svalbard.
The practical implication: use OVATION for the spatial picture and Kp for the intensity context. OVATION tells you where the aurora is; Kp tells you how intense the event is and whether it is growing or decaying. Cross-referencing both on DXRadar gives you the best operating picture.
A rising Kp with an OVATION oval not yet reaching your latitude means the storm is intensifying and the oval is about to expand to you. A declining Kp with the OVATION oval already at your latitude means the event has peaked and aurora scatter will fade in the next few hours.
OVATION's Limitations: When the Model Is Wrong
OVATION performs well under steady-state solar wind conditions — slow, gradual changes in Bz and solar wind speed. Its limitations appear most clearly in these scenarios:
Sudden Substorms
A substorm is a sudden explosive release of energy stored in the magnetotail, producing a rapid auroral brightening that can increase precipitation energy by a factor of 10 or more in minutes. Substorms are not directly predictable from solar wind parameters alone — they depend on internal magnetospheric dynamics. OVATION can miss substorms entirely, producing a moderate probability forecast while the actual aurora erupts into overhead curtains.
This is why experienced aurora observers check OVATION for the background condition and watch the real-time magnetometer data from high-latitude stations (Tromsø, Fairbanks, Yellowknife) to catch substorm signatures that the model has not yet detected.
Rapid Bz Rotations
The interplanetary magnetic field can rotate from strongly southward (negative Bz, strong coupling) to northward (positive Bz, weak coupling) in minutes. During a rotating field event, OVATION can lag the actual state by one model update cycle. If Bz abruptly turns northward, the aurora will begin fading roughly 15–30 minutes later — but OVATION, still reflecting the previous negative Bz condition, will show high aurora probability briefly after activity has already peaked.
Always check the current Bz alongside the OVATION map. If Bz is positive and rising, treat the OVATION forecast as retrospective.
High-Energy Particle Events (SEPs)
Major solar proton events (from X-class flares) can damage or degrade the DSCOVR sensors that feed OVATION. When sensor data quality is flagged or missing, NOAA may switch to backup data sources (ACE) or interpolate. The map quality degrades during these events — exactly when you most want reliable aurora information.
How DXRadar Fetches and Displays OVATION Data
DXRadar fetches the NOAA OVATION JSON endpoint (/json/ovation_aurora_latest.json) on a regular update cycle. The JSON contains an array of geographic coordinates with associated aurora energy flux values, which are converted to probability percentages and rendered as a polygon overlay on the MapLibre GL map canvas.
The aurora probability is drawn as a semi-transparent color gradient over the polar regions, with the equatorward boundary of the green probability region visible on the map. The refresh rate matches the NOAA update frequency: the model updates every minute, and DXRadar pulls fresh data accordingly, so the oval position you see on the map is current to within a few minutes.
Additional live data displayed alongside the OVATION oval on the DXRadar aurora dashboard:
- Live Kp — current planetary index from the most recently completed 3-hour window
- Live Bz — real-time IMF south-north component from DSCOVR
- Solar wind speed — updated from DSCOVR real-time data
- Kp trend — whether Kp is rising, stable, or declining
Cross-referencing all four gives a more complete picture than the oval alone. A moderate OVATION probability with strongly negative Bz and rising Kp is more actionable than the same OVATION probability with Bz returning to zero — the former is likely to intensify, the latter is likely to fade.
Using OVATION for Aurora Scatter Planning
For ham operators using OVATION specifically for 6m aurora scatter planning, the key decision threshold is whether the equatorward boundary of the OVATION green region has reached within 10 degrees of your geomagnetic latitude.
A step-by-step approach for a station at 50° N geographic latitude (roughly 52° N geomagnetic for an eastern North American or western European QTH):
- Open the DXRadar aurora dashboard
- Check the current Bz — if negative (below −5 nT), conditions are supportive
- Check Kp — if 4 or higher and rising, the oval is expanding toward mid-latitudes
- Look at the OVATION oval equatorward boundary — if green/yellow reaches to 57–60° N on the map and Kp is still climbing, aurora scatter at 50° N is imminent
- Check DXMaps.com 6m spots — if European or North American stations are reporting aurora scatter contacts, the path is already open
- Point your 6m beam north and tune 50.313 MHz FT8 or listen on 50.110 MHz CW
The OVATION map gives you 5–15 minutes of advance warning before the aurora reaches your latitude, which is enough time to get to the radio, orient the antenna, and start calling.
Pro Tip: Bookmark the DXRadar aurora dashboard on your phone. When NOAA issues a G1 or higher storm watch, check the page every 15–20 minutes as the storm develops. The OVATION oval will visibly expand toward lower latitudes in real time as Kp rises — you can watch it approach your latitude and pick the optimal moment to get on the air.
Frequently Asked Questions
What is the OVATION aurora model?
OVATION (Oval Variation, Assessment, Tracking, Intensity, and Online Nowcasting) is NOAA's operational aurora nowcast model, developed with Johns Hopkins University Applied Physics Laboratory. It uses live solar wind and IMF data from DSCOVR at the L1 Lagrange point to predict the position, shape, and intensity of the auroral oval, updated every minute. The underlying model (OVATION Prime-2013) is derived from a 20-year empirical database of satellite auroral measurements (Newell et al., Space Weather, 2014).
How accurate is the OVATION aurora forecast?
OVATION is accurate under steady solar wind conditions and provides reliable aurora probability maps for most geomagnetic storm events. Its main limitations are substorm prediction (internal magnetospheric dynamics not captured by solar wind alone) and latency during rapid Bz rotations. The 20–40 minute L1-to-Earth propagation delay means the model is a true nowcast of near-future conditions, not a measurement of what is happening right now. Cross-reference with real-time Bz and ground magnetometer data for best accuracy.
What do the OVATION probability colors mean?
Green (1–30%) indicates faint aurora possible; yellow/orange (30–80%) indicates active aurora likely; red (80–100%) indicates bright aurora near-certain. Gray indicates no auroral precipitation. For 6m aurora scatter, the relevant threshold is when the green region's equatorward boundary reaches within 10–15 degrees of your geomagnetic latitude — scatter paths are possible even before the oval is directly overhead.
How often is the OVATION model updated?
NOAA updates OVATION every minute as new DSCOVR solar wind measurements are processed. DXRadar fetches the NOAA OVATION JSON endpoint on the same schedule, so the aurora map overlay you see on the aurora dashboard is current to within a few minutes.
What solar wind parameters does OVATION use?
The primary inputs are solar wind speed, proton density, IMF Bz (north-south component), and IMF By (east-west component), all measured by DSCOVR at L1. Negative Bz (southward IMF) is the dominant driver — when Bz drops below −10 nT, the coupling efficiency increases sharply and the aurora responds within the L1-to-Earth transit time of 15–60 minutes.