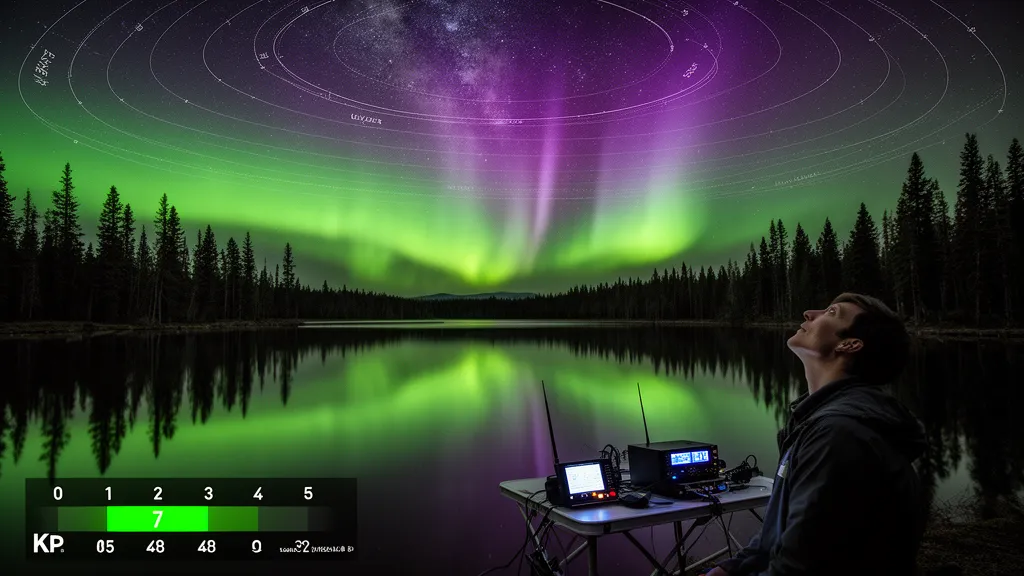
Operator's Verdict: Current Kp: The planetary K-index is 0 right now. Check the DXRadar aurora page for the live NOAA OVATION auroral oval position and HF impact assessment.
What Kp Level Actually Produces Aurora at Your Latitude
The Kp index does not have one universal aurora threshold — it depends entirely on your geographic latitude, and more precisely on your geomagnetic latitude. At Kp 3, aurora is routine in Iceland. The same Kp 3 produces nothing visible in Texas. The table below gives practical visibility thresholds for naked-eye aurora under dark, clear skies:
| Geographic Latitude | Example Locations | Minimum Kp for Aurora |
|---|---|---|
| 65°N+ | Tromsø (Norway), Reykjavik (Iceland), Fairbanks (Alaska) | Kp 2–3 |
| 60°N | Helsinki (Finland), southern Alaska, Juneau | Kp 3–4 |
| 55°N | Edinburgh (Scotland), Oslo (Norway), Edmonton (Canada) | Kp 5 |
| 50°N | London (UK), Winnipeg (Canada), Prague | Kp 6 |
| 45°N | Portland (Oregon USA), northern France, northern Italy | Kp 7 |
| 40°N | Philadelphia (USA), Madrid (Spain), Beijing | Kp 8 |
| 35°N | Atlanta (USA), Tokyo, Albuquerque | Kp 8–9 |
| Below 30°N | Florida, Hawaii, Mexico City | Kp 9 (extreme only) |
These thresholds represent the minimum for naked-eye visibility on the northern horizon under ideal dark-sky conditions. Well-exposed photographs can capture aurora at one to two Kp steps lower than the naked-eye threshold, which is why aurora chasers increasingly report photographed aurora that was invisible to the eye.
What the Kp Index Measures
Kp is the planetary K-index — a 3-hourly average of geomagnetic disturbance from 13 sub-auroral observatories worldwide. Individual stations each report a local K-index (0–9) based on the maximum variation in the horizontal component of Earth's magnetic field over a 3-hour window. The planetary Kp averages these to produce a global estimate of geomagnetic activity (NOAA SWPC).
The scale is quasi-logarithmic: each step up represents approximately a 1.5-fold increase in magnetic field disturbance amplitude. This means Kp 6 is not just slightly worse than Kp 5 — the field disturbance is about 1.5 times larger. A Kp 9 event involves roughly 100 times the magnetic field variation of a Kp 0 day.
New Kp estimates are published every 15 minutes on the NOAA SWPC website. NOAA also provides a 3-day forecast based on active region tracking, CME modeling, and solar wind measurements from the DSCOVR satellite at L1.
Pro Tip: The DXRadar aurora page displays the NOAA OVATION auroral oval in real time, overlaid on a map. Rather than guessing from Kp alone, you can see exactly how far south the aurora boundary extends. If the oval edge reaches your latitude on the map, aurora may be visible looking north.
NOAA G-Scale: Geomagnetic Storm Severity
NOAA defines geomagnetic storm severity using the G-scale (G1–G5), directly tied to Kp levels. The G-scale describes the expected impacts on technology and aurora visibility:
| Kp | G-Scale | Storm Level | Aurora Visibility | HF Impact |
|---|---|---|---|---|
| 5 | G1 | Minor | 60°N geomag. lat. — Scotland, southern Scandinavia | High-latitude HF begins to degrade |
| 6 | G2 | Moderate | 55°N geomag. lat. — northern England, southern Canada | Transpolar routes degrade seriously |
| 7 | G3 | Strong | 50°N geomag. lat. — northern USA, central Europe | Mid-latitude high-band paths affected |
| 8 | G4 | Severe | 45°N geomag. lat. — US Midwest, central Europe | Wide HF disruption |
| 9 | G5 | Extreme | 40°N geomag. lat. — southern USA, southern Europe | Extreme HF disruption, possible blackouts |
The last G5 event (Kp 9) occurred in May 2024 — the strongest geomagnetic storm since the Halloween storms of October 2003. Aurora was visible from Florida, Texas, and even parts of Mexico. On the radio side, 20m collapsed on polar and transpolar paths while 40m NVIS remained productive for operators south of 45°N. The May 2024 event produced some of the most widespread aurora photography in a decade (NOAA SWPC).
Why Geomagnetic Latitude Matters More Than Geographic Latitude
The aurora borealis follows the auroral oval, which is aligned with Earth's magnetic pole, not the geographic pole. Earth's magnetic north pole is currently located near 86°N, 159°W — geographically within the Arctic Ocean, but offset from the geographic North Pole. This offset means that geomagnetic latitude differs from geographic latitude depending on your longitude.
The practical consequence: North America sits further under the auroral oval than Europe at the same geographic latitude. A station in Quebec at 50°N geographic is at approximately 60°N geomagnetic latitude. A station in central Europe at 50°N geographic sits around 45–48°N geomagnetic. During a G2 storm (Kp 6), the Quebec station may see overhead aurora while the European station sees only a low glow on the northern horizon.
This is why aurora is statistically more commonly seen from eastern Canada and the northern USA than from continental Europe at equivalent geographic latitudes. The magnetic pole's position in northern Canada tilts the auroral oval toward North America.
Substorms: Why Kp Is Not the Whole Story
A moderate Kp of 4–5 can still produce brief, intense aurora if a magnetospheric substorm occurs. Substorms are sudden releases of stored energy in the magnetosphere's tail region, independent of the overall Kp level. During a substorm, the auroral oval rapidly brightens and shifts southward for 15–60 minutes before settling back.
Substorms can spike the local K-index at high-latitude stations to values of 7–8 for a single 3-hour window even when the planetary Kp remains at 4–5. If you are at a northern latitude and see a sudden explosive aurora display without a corresponding Kp 7+ alert, a substorm is the likely cause.
For radio operators, substorms cause brief, intense absorption events at high latitudes. A path that was degraded but usable at Kp 4 may fail completely for 20–30 minutes during a substorm, then partially recover.
How Kp Affects HF Radio Propagation
The aurora is not just a visual phenomenon — it is the visible marker of ionospheric electron precipitation and absorption. Every unit increase in Kp above 3 increases absorption on high-latitude HF paths. The higher the Kp, the further south the absorption zone extends.
Transpolar and Polar Routes
Transpolar HF routes — North America to Asia via the Arctic, or North America to northern Europe via Greenland — cross the geographic polar cap. These routes experience the most severe storm impacts:
- Kp 5: Noticeable degradation on transpolar paths. Some paths become unreliable.
- Kp 6: Serious degradation. Most transpolar routes fail or require lower frequencies.
- Kp 7+: Transpolar routes largely unusable. Operators using these paths shift to non-polar routing or lower frequencies.
Mid-Latitude Paths
Mid-latitude paths (great-circle routes that do not cross above 55°N) are more resilient but still affected at high Kp:
- Kp 5–6: Paths passing through the high-latitude zone (50°–60°N great-circle) start to degrade on 10m and 15m.
- Kp 7–8: Even paths crossing 45–50°N experience F2 layer disruption due to the storm's negative phase — a period of reduced ionospheric electron density caused by storm-time thermospheric chemistry changes.
- Kp 9 (G5): The entire HF spectrum can be disrupted at mid-latitudes during the main phase of an extreme storm. This is what operators experienced during the May 2024 G5 event.
Aurora Scatter on VHF
While high Kp degrades HF, it opens opportunities on VHF. Aurora scatter on 6m and 2m VHF becomes possible when the auroral oval extends to your latitude and above. Aurora scatter signals have a distinctive buzzy, harsh audio quality — CW tones become rough, SSB voices are distorted to the point of being difficult to copy. CW, SSB, and even FT8 contacts via aurora scatter are logged during significant storms.
For aurora scatter to work, you need to point your beam antenna toward the auroral oval — typically north or northeast/northwest from mid-latitudes — not toward the distant station. Both stations reflect off the aurora simultaneously and the signal takes an indirect path.
The NOAA OVATION Model: Real-Time Aurora Prediction
The DXRadar aurora page displays the NOAA OVATION aurora forecast model, which predicts the auroral oval position and intensity 30–40 minutes ahead based on live solar wind data from DSCOVR at L1. OVATION translates solar wind speed, density, and Bz into a predicted energy input into the polar ionosphere.
The OVATION output shows a map of the predicted auroral oval with colour-coded intensity. The equatorward boundary of the oval gives you the latitude at which aurora may be visible on the northern horizon. If the OVATION model shows the boundary near your latitude, look north.
OVATION is the same model that powers major aurora alert services and apps. The advantage of the live map view is that you can see the spatial structure of the oval — whether it is uniformly expanded or concentrated in certain longitude sectors.
Practical Tips for Aurora Observation
If Kp is rising toward your visibility threshold, the following operational tips improve your chances:
Timing: Aurora is most active during the 2–3 hours around local magnetic midnight (which roughly corresponds to solar midnight, typically 23:00–02:00 local time). This is when the magnetospheric tail is oriented toward your QTH and substorm activity peaks.
Horizon view: You only need a clear view of the northern horizon (or southern horizon if you are in the Southern Hemisphere). Even slight obstructions toward the north significantly reduce visible aurora. Trees at 200 metres cut off aurora that would otherwise be visible.
Camera vs. eyes: Modern smartphone cameras detect aurora at Kp values 1–2 steps below naked-eye visibility. Long exposures (3–10 seconds) on a tripod routinely capture aurora that the eye cannot see. If you are at 50°N and Kp is 5–6, take a long-exposure photo toward the north even if you see nothing — the camera may capture a faint green arc.
Dark adaptation: Your eyes need 15–20 minutes of darkness to fully adapt. Checking your phone during the 15-minute dark adaptation window resets the clock. Use red light only if you need to check the DXRadar aurora page for updates.
Frequently Asked Questions
What Kp do I need to see the northern lights from the UK?
From Scotland (approximately 56°N geographic, 50–52°N geomagnetic), Kp 5 is typically the minimum for visible aurora. From England at 51–54°N geographic, Kp 6 is required for reliable naked-eye visibility. During G4–G5 events (Kp 8–9), aurora has been photographed from southern England and Wales. The May 2024 G5 storm produced overhead aurora from much of England (NOAA SWPC).
Can I see the northern lights at Kp 3?
At Kp 3, aurora is readily visible from latitudes of 65°N and above — Iceland, northern Norway, northern Finland, and equivalent latitudes. From 60°N (southern Finland, southern Alaska), Kp 3–4 may produce a faint arc on the northern horizon under dark, clear skies. From below 55°N, Kp 3 produces no visible aurora except in long-exposure photography from very dark sites.
What was the highest Kp in recent history?
The highest Kp of the current solar cycle occurred during the May 10–12, 2024 geomagnetic superstorm, which reached Kp 9 (G5 extreme) — the strongest geomagnetic storm since October 2003. Aurora was observed across the continental USA, southern Europe, and even parts of northern Mexico. The storm was driven by multiple X-class flares and a series of CME arrivals with strong southward Bz (NOAA SWPC).
Does Kp affect GPS?
Yes. During major geomagnetic storms (G3+, Kp 7+), ionospheric irregularities cause GPS signal scintillation, particularly at high latitudes and around the equatorial ionosphere. Timing errors of metres to tens of metres are possible in severe storms. Aviation and precision agriculture GPS systems use redundant systems and SBAS corrections to mitigate this. For handheld GPS navigation, a G5 storm may cause intermittent unreliable fixes at high latitudes.
How long does a high-Kp event last?
A typical G1–G2 geomagnetic storm (Kp 5–6) lasts 12–24 hours from onset to recovery. G3–G4 storms may persist for 24–48 hours. Extreme G5 events like May 2024 can last 2–3 days. Storm phases include a sudden commencement (CME shock arrival), a main phase (Kp peaks), and a recovery phase (gradual return to baseline). The recovery phase is when Kp is decreasing but still elevated — aurora may remain visible at moderate latitudes throughout recovery.
For companion reading, see Aurora and Ham Radio: The Full HF Impact Guide and Understanding the K-Index. Monitor the current auroral oval and live Kp on the DXRadar aurora page.