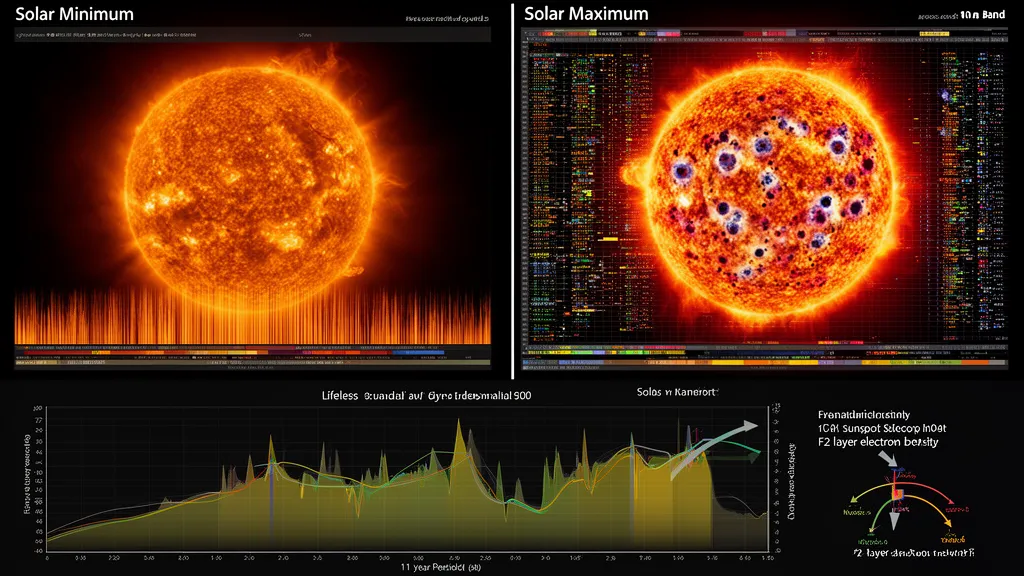
Operator's Verdict: Sunspot number is the single most useful long-range predictor of HF band conditions. At SSN above 150, work 10m and 12m aggressively — these openings are not permanent. At SSN below 50, abandon 15m for DX and concentrate on 40m and 20m. Right now, DXRadar is tracking the current SSN live on the solar weather page.
How Sunspots Drive Ionospheric Propagation
Sunspots are dark regions on the solar photosphere where intense magnetic field activity suppresses convective heat transport, cooling the surface to roughly 4,000 K compared to the surrounding photosphere at 5,778 K (as measured by Kurucz et al. and confirmed by SOHO/MDI instruments). Despite appearing dark in visible light, sunspot active regions are surrounded by bright faculae and produce substantially elevated ultraviolet and extreme ultraviolet (UV/EUV) radiation.
This UV/EUV radiation is what matters for HF propagation. It reaches the upper atmosphere at the speed of light — 8 minutes from the Sun to Earth — and photoionizes oxygen and nitrogen in the F2 layer at altitudes of 250–400 km. More sunspot activity means more UV/EUV, which means higher electron density in the F2 layer, which means higher foF2 (critical frequency), which means higher MUF over any given path, which means higher-frequency HF bands can support long-distance propagation.
The chain from sunspot to band opening is direct and measurable. The International Sunspot Number (ISN), published daily by the SILSO (Solar Influences Data Analysis Center) at the Royal Observatory of Belgium, is the standard measure used by propagation software, NOAA SWPC forecasts, and the ITU-R P.533 propagation model.
On your radio, the effect is unmistakable. During solar minimum (SSN < 30), 40m and 20m carry DX traffic while 15m and 10m sit silent through entire operating sessions. Then, as the cycle rises past SSN 100, one morning you turn on the radio and 10m is full of signals — Caribbean stations, South Americans, Europeans — all easily accessible at power levels that would require a serious station on 20m. At SSN 180 during Cycle 25, 10m worked like a local repeater: S9 signals from stations 15,000 km away on a 100W station with a simple dipole.
Pro Tip: Monitor DXRadar's solar weather dashboard for real-time space weather data — check it before every operating session.
The International Sunspot Number: How It Is Measured
The ISN is not a simple count of sunspot blemishes. It is a weighted index defined as:
ISN = k × (10 × G + S)
Where G is the number of sunspot groups, S is the total number of individual sunspots, and k is a station correction factor normalizing each observing station's count against a reference telescope. The Royal Observatory of Belgium aggregates reports from a global network of observatories and publishes the daily ISN typically the following UTC day.
SILSO (silso.oma.be) is the World Data Center for sunspot records. The current version of the ISN is Version 2.0, recalibrated in 2015 to correct for inconsistencies in the historical record introduced by changes in reference observers. The recalibration removed the artificial suppression in the ISN during the mid-20th century — Cycle 19's SSN 253 peak is now confirmed as the highest on record.
For daily radio operations, the ISN provides a 3-month smoothed value (better for cycle phase tracking) and a daily value (useful for current conditions, though noisy). The Solar Flux Index (SFI) published by NRC Canada from the Penticton Observatory is operationally more useful for day-to-day propagation because it is measured continuously, available same-day, and directly proxies the UV/EUV flux ionizing the F2 layer. The empirical relationship between the two:
SFI ≈ 0.8 × SSN + 67 (approximate, with scatter of ±10–15 SFU)
At SSN 0 (deep minimum), SFI ~ 67 SFU. At SSN 100, SFI ~ 147 SFU. At SSN 200, SFI ~ 227 SFU. These are approximations — the correlation holds statistically but individual days diverge significantly.
SSN and the Solar Cycle: The 11-Year Rhythm
The solar cycle — the periodic rise and fall of sunspot activity — averages 11.0 years from minimum to minimum, with a range of 9–14 years across the historical record. Hathaway (2015, Living Reviews in Solar Physics) provides the definitive modern analysis. The mechanism driving the cycle is the Sun's internal magnetic dynamo: differential rotation in the solar convection zone winds up magnetic field lines until they become buoyant, break through the surface, and form sunspot groups.
The cycle number (currently 25) has been assigned continuously since Cycle 1 began around 1755. Key reference points:
| Cycle | Peak SSN (V2.0) | Peak Year | Notes |
|---|---|---|---|
| 19 | 285 | 1958 | Highest recorded; 10m like VHF |
| 21 | 233 | 1980 | Strong; 10m/12m/15m all excellent |
| 22 | 212 | 1990 | Last pre-internet major cycle |
| 23 | 180 | 2001 | Moderate; marked beginning of "grand minimum" concern |
| 24 | 116 | 2014 | Weakest in 100 years; 10m barely opened |
| 25 | ~240 | 2024–2025 | Significantly exceeded official NOAA forecast of 115–137 |
The contrast between Cycle 24 and Cycle 25 is the most dramatic in recent decades. Operators who received their licenses during Cycle 24's deep minimum — with SFI barely reaching 150 at the peak — experienced Cycle 25 as a revelation. 10m and 12m opened to DX traffic that had not been seen since the Cycle 22 peak in 1990.
The lesson for any HF operator starting during a weak cycle: what you experience is not the full capability of HF propagation. Wait for the next peak.
Band-by-Band Effects at Different SSN Levels
The MUF over a 3,000 km path scales approximately with foF2 × 3.5 (the obliquity factor for a mid-latitude F2 path). foF2 itself scales with the square root of NmF2 (maximum electron density), which scales roughly linearly with solar EUV flux and therefore with SSN. The practical result is a predictable set of band openings at each SSN level.
| SSN Range | SFI Range (approx.) | Bands Reliably Open for DX | Notes |
|---|---|---|---|
| 0–30 | 67–91 | 40m, 20m | Solar minimum; 15m unreliable; 10m dead except Es |
| 30–70 | 91–123 | 40m, 20m; 17m marginal | Rising cycle; 15m occasional at equinox |
| 70–100 | 123–147 | 40m, 20m, 17m, 15m | Mid-cycle; 10m shows first openings |
| 100–130 | 147–171 | 20m, 17m, 15m; 12m marginal | 10m opens regularly at equinox |
| 130–170 | 171–203 | 20m, 17m, 15m, 12m, 10m | Full HF spectrum DX-capable |
| 170–200 | 203–227 | All HF bands including 12m/10m routinely | 10m worldwide openings most days |
| 200+ | 227+ | As above, with 10m approaching VHF-like conditions | Rare signals on 6m F2; 10m S9+ DX |
These thresholds are approximate and latitude-dependent. At equatorial latitudes (±10°), the equatorial ionization anomaly keeps foF2 elevated even at moderate SSN, opening 10m at SSN 70–80. At high latitudes (above 55° N or S), even SSN 150 does not guarantee 10m openings because the F2 layer at those latitudes is less responsive to solar flux.
Seasonal effects compound the SSN effect. 10m is most reliably open at equinox (March and September) even at the same SSN. The equatorial F2 anomaly is strongest at equinox. Winter at high latitudes suppresses F2 ionization even during solar maximum. Summer on one hemisphere benefits the other via long-path propagation through the summer ionosphere.
How to Use SSN in Your Operating Plan
The practical application of SSN awareness is band selection before a DX session. You do not need to track SSN daily — the trends matter more than daily values. Here is the workflow:
1. Check current SSN and SFI on DXRadar's solar weather page The current SFI is updated every 10 minutes from NOAA SWPC data. The smoothed SSN from SILSO is shown alongside it. Together, they tell you where you are in the cycle and what bands are theoretically ionized.
2. Translate to expected band conditions Using the table above, identify which bands should be open for DX. If SFI is 180, expect 15m, 12m, and 10m to be active for mid-latitude DX on this date and your solar time window.
3. Cross-reference with Kp Even at SSN 200, a Kp 6 storm can shut down 15m and 10m on paths crossing mid-latitudes. Check Kp in real time. If Kp is above 4, reduce expectations for higher bands and shift to 20m and 40m.
4. Time your operation The F2 layer peaks 2–4 hours after local noon at the path midpoint. For a path from the eastern USA to Europe, the midpoint is roughly over the mid-Atlantic — local noon there is about 14:00–15:00 UTC. Peak F2 ionization (and therefore peak MUF) on that path occurs around 16:00–18:00 UTC. This is the sweet spot for 15m and 10m to Europe on a high-SSN day.
What High SSN Sounds Like on the Air
The experiential dimension is worth describing explicitly, because it is what motivates operators to pay attention to the cycle.
At SSN 50 (solar minimum), 10m sounds like a dead room. Occasionally a carrier appears, builds briefly to S4–S5, and fades. Es may open to Europe for an hour in summer. The noise floor sits below S1, but there are no DX signals. 15m is more active but still thin — only the strongest stations from the best-ionized paths. The 20m SSB segment is crowded because everyone is compressed onto the reliable bands.
At SSN 150, 10m sounds like 20m on a good day. The morning opening to Europe produces S9+ signals. By early afternoon, the transpolar path to Japan opens. South Americans appear in the afternoon. Caribbean stations are full quieting. 15m and 12m are both simultaneously active with multiple continents. The 20m band, no longer as crowded, shows a noticeable drop in QRM as operators spread across the spectrum.
At SSN 200+ — as observed during Cycle 25 in 2024–2025 — 10m approaches what Cycle 19 veterans describe as the band's character during the 1958 peak: S9+20 dB signals from multiple continents simultaneously, contacts made on 5 watts with a wire antenna, and 6m showing F2 openings that would be remarkable in any other cycle. The ITU-R P.533 propagation model predicts this from first principles; the experience on the air confirms it.
Cycle 25: Exceeding Every Prediction
Solar Cycle 25 began in December 2019 by NOAA/ISES convention. The official Solar Cycle 25 Prediction Panel, publishing in December 2019, forecast a weak-to-moderate cycle peaking at SSN 115–137 — essentially a repeat of the underwhelming Cycle 24. The physical basis for this prediction was extrapolation from precursor signals (the polar field strength at cycle minimum) which suggested a modest cycle.
The Sun did not comply. By mid-2023, it was already clear that Cycle 25 was tracking significantly above predictions. The smoothed monthly SSN exceeded 200 around late 2024 / early 2025 — higher than any cycle since Cycle 22 peaked at SSN 212 in 1990. The May 2024 geomagnetic storm (G5, Kp 9.33) confirmed that the active region productivity of Cycle 25 was far above the predicted level.
For radio operators, the consequence was an extraordinary DX window on 10m, 12m, and 15m that many operators under age 45 had never experienced. Stations that had only ever known the solar minimum and the weak Cycle 24 peak suddenly found 10m full of DX. License upgrades accelerated; 10m activity on FT8 set DX records; the 10m WSPR distance records were regularly broken during equinox openings.
The NOAA SWPC forecast page shows the current cycle progression against the predicted range in real time — the observed SSN has been above the high end of the prediction band since approximately mid-2023.
The Role of Active Regions, Not Just Sunspot Count
SSN is a statistical proxy, not a direct physical mechanism. What actually matters is the active region configuration on the visible solar disk at any moment — specifically, whether the active regions facing Earth are producing UV/EUV radiation at an elevated rate.
Large sunspot groups in beta-gamma-delta magnetic configurations are associated with the highest EUV output AND with flare and CME production. This is why the SFI can spike during an active region transit even without a major increase in SSN, and why a high SSN does not guarantee high SFI on any specific day.
The 10.7 cm flux (SFI) is the more operationally direct measurement because it is physically produced by active regions — free-free (bremsstrahlung) emission from hot plasma associated with the same active regions that produce EUV. When a large active region rotates onto the solar disk, SFI rises before the visible sunspot count peaks. When it rotates off, SFI falls. The 27-day solar rotation period creates a predictable modulation in SFI and, consequently, in MUF and band conditions.
Experienced operators track the 27-day recurrence of SFI peaks. If SFI was 185 three weeks ago and the large active region that caused it has survived another rotation, conditions will recur approximately 27 days after the previous peak. This is not guaranteed — regions decay or grow — but it is a useful planning heuristic validated empirically in every solar cycle.
Frequently Asked Questions
How do sunspots affect radio propagation?
Sunspot active regions emit intense ultraviolet and extreme ultraviolet radiation that photoionizes the F2 layer of the ionosphere at 250–400 km altitude. Higher sunspot activity means higher UV/EUV flux, which raises the F2 layer's maximum electron density (NmF2) and critical frequency (foF2). A higher foF2 means the MUF over any given path increases, allowing higher-frequency HF bands — 15m, 12m, and 10m — to support long-distance propagation that would otherwise be impossible.
What sunspot number is needed for 10m to open?
An ISN above 100 begins to produce regular 10m (28 MHz) DX openings on mid-latitude paths, particularly around the equinox months. Above SSN 150, 10m opens to multiple continents most days during the peak solar-time window. Below SSN 70, 10m DX is rare and limited to equatorial paths and sporadic-E. These thresholds are latitude-dependent — equatorial stations see 10m activity at lower SSN values than operators at 50° N or S.
How long does a solar cycle last?
The solar cycle averages 11 years from minimum to minimum. The rise from minimum to maximum takes 4–5 years; the descent to the following minimum takes 5–7 years, making the decline generally slower than the ascent. The 11-year figure is an average — individual cycles range from 9 to 14 years. Long-term predictions of cycle length are not reliable beyond about one cycle in advance.
What was the sunspot number at the Cycle 25 peak?
Solar Cycle 25 significantly exceeded the official NOAA/ISES prediction of SSN 115–137. The smoothed monthly ISN exceeded 200 around late 2024 to early 2025 — higher than any cycle since Cycle 22 peaked at 212 in 1990. The May 2024 G5 geomagnetic storm was one indicator of the cycle's unexpected strength. The cycle outperformed all four major forecasting methods used by the official prediction panel.
Is the sunspot number the same as the solar flux index?
No. The International Sunspot Number (ISN) is a geometrically weighted count of sunspot groups and individual spots. The Solar Flux Index (SFI) measures microwave emission from the Sun at 10.7 cm wavelength in solar flux units (SFU). They correlate statistically (roughly SFI ≈ 0.8 × SSN + 67) but diverge on individual days. SFI is the more operationally useful metric for day-to-day propagation because it is measured continuously, available same-day from NOAA, and directly proxies the solar UV/EUV flux that ionizes the F2 layer.