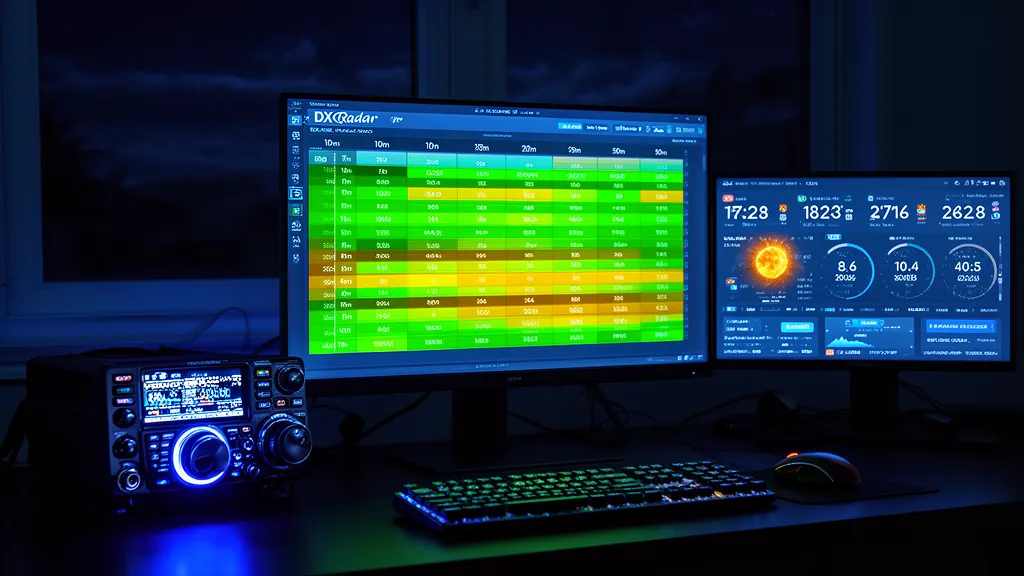
What DXRadar Is and What Problem It Solves
DXRadar is a real-time HF propagation tool that shows licensed amateur radio operators which bands are open right now, not on average or statistically. It pulls live solar data from NOAA SWPC every 5–10 minutes and live reception reports from PSKReporter every 10 minutes, combines them through a propagation model, and displays the result as color-coded band scores updated continuously throughout the day.
The problem DXRadar addresses: existing tools show either statistical averages or manual forecasts. VOACAP produces long-term statistical propagation probability — useful for antenna planning, but not for deciding whether to call CQ on 10m in the next 15 minutes. HamQSL's propagation page shows calculated averages for an idealized mid-latitude station. Neither tool shows what is actually happening on the bands at your specific QTH, right now, based on today's solar conditions and observed reception reports.
DXRadar combines the model's predictive structure with observed reality. When the model says 10m should be open and PSKReporter confirms dozens of spots forming a clear propagation lane on the map, the band score goes green with high confidence. When the model says 10m should be open but PSKReporter shows no spot activity despite active stations transmitting, the score reflects the discrepancy. Real propagation trumps theory.
The current SFI is 137 and Kp is 0.33 — both are live values from NOAA SWPC, fetched within the last 10 minutes. See the solar weather dashboard for the full telemetry breakdown.
The Data Pipeline: From NOAA to Your Band Score
DXRadar's backend pulls data from two primary external sources on a continuous schedule.
NOAA SWPC supplies the solar data:
- SFI (Solar Flux Index) — updated at 17:00, 20:00, and 23:00 UTC daily from the Dominion Radio Astrophysical Observatory. DXRadar uses the adjusted daily value.
- Planetary K-index (Kp) — 3-hourly geomagnetic activity index updated by NOAA. Drives the geomagnetic disturbance assessment.
- Solar wind plasma — speed, density, and temperature from the DSCOVR satellite at L1, updated every 5 minutes.
- Interplanetary magnetic field (Bz component) — southward Bz drives geomagnetic storms; DXRadar monitors this for real-time storm onset detection.
- X-ray flux — 1-minute cadence data from the GOES satellites, used for solar flare detection and D-layer absorption alerts.
PSKReporter supplies the observed propagation data:
- Reception reports from the global network of amateur radio receivers running WSJT-X, JS8Call, and other digital mode software
- DXRadar fetches a single global pull every 10 minutes covering all bands simultaneously — not per-band polling, which would exceed PSKReporter's rate limits
- Each report includes: reporting station callsign, transmitting station callsign, frequency, signal-to-noise ratio (dB), and timestamp (UTC)
- DXRadar aggregates these reports into band-specific spot clusters, identifying propagation lanes and computing activity density per geographic region
The backend processes these two streams through an HF propagation model based on ITU-R P.533 MUF estimation. For each band at each QTH (determined by your browser's geolocation or manually set Maidenhead grid square), the system computes:
- Theoretical MUF for representative paths in each compass direction, using current SFI to estimate foF2
- Estimated D-layer absorption, derived from solar zenith angle and current X-ray flux
- Observed propagation from PSKReporter spot clusters at the relevant frequencies
- A composite band score (0–100) weighting both model and observed data
The result updates the band board every 5 minutes.
The Band Board: Reading Your Live Band Status
The band board is the DXRadar homepage — the at-a-glance view of all HF bands from your QTH. Each band shows a score from 0 to 100 with a color indicator: green (score 60+, band open), yellow (30–60, marginal or limited openings), red (below 30, band closed or poor conditions).
The score reflects the composite of model prediction and observed activity. A band can score green even at low SFI if PSKReporter shows active spot clusters at that frequency, indicating actual propagation. Conversely, a theoretically favorable SFI may score yellow if no spots are observed — because the model is a statistical expectation, not a guarantee.
Current band scores are live:
- UNKNOWN on 10m
- UNKNOWN on 20m
For the full band-by-band live assessment, see best bands right now.
Each band score links to its dedicated band page (for example, /band/10m) which shows additional detail: the SFI threshold analysis for that band, PSKReporter spot map filtered to that frequency, historical band performance at the current SFI level, and a time-of-day chart showing when the band typically peaks.
Pro Tip: Before a POTA activation or contest session, open /best-bands-now on your phone. It shows which HF bands have the highest observed activity density from your QTH right now — saving the guesswork about whether to start on 20m or 17m for a given session.
The 3D Solar Weather Globe
The solar weather globe is a WebGL-rendered 3D Earth with real-time space weather overlays. It uses GPU-accelerated rendering to handle the data density required for simultaneous display of multiple large geophysical datasets.
Current overlays visible on the globe:
- Gray line terminator — the sunrise/sunset boundary updated in real time. Essential for gray line operating planning on 40m, 80m, and 160m.
- MUF contours — colored regions showing the Maximum Usable Frequency across Earth's surface, computed from current SFI. Green regions support 10m; yellow regions support 20m; red regions are limited to 40m and below.
- D-layer absorption — intensity of daytime HF absorption, derived from solar zenith angle and current X-ray flux. Heavy absorption shows clearly on paths crossing the solar noon region.
- Aurora oval — the predicted aurora boundary from NOAA's OVATION model, updated every 5 minutes. Indicates where geomagnetic activity is impacting HF propagation and where visible aurora may occur.
- CME tracks — when space weather alerts include CME arrival predictions, estimated impact zones appear on the globe.
The globe is the fastest way to understand your specific path geometry. Orient it toward your target DX entity and visually assess whether the path crosses the high-absorption noon region, whether the path endpoint is near the aurora oval, and whether the gray line is favorably aligned for low-band DX.
The /is-10m-open Page: Dedicated Band Analysis
The /is-10m-open page provides a focused analysis of current 10-meter conditions beyond what the band board shows. It was designed for operators who specifically want to know whether 10m is worth operating before sitting down at the radio.
The page shows:
- Current SFI with 7-day trend — not just today's value. A rising SFI is more significant than a stable SFI at the same level, because the ionosphere responds to cumulative solar UV over 24–48 hours. The trend is more predictive than a single daily value.
- 10m MUF estimate — the estimated MUF for representative paths from your QTH location, displayed by compass direction.
- PSKReporter 10m spot map — live spot density on 28 MHz frequencies showing where propagation lanes are active right now.
- Band status verdict — a plain-language assessment: "10m is open to Europe and South America," or "10m is marginal — sporadic-E possible but no F2."
This combination of model, observed data, and trend gives a more actionable answer than SFI alone. A static SFI of 140 SFU might indicate good conditions in theory, but if the PSKReporter spot map shows zero 10m activity at 15:00 UTC — normally prime time — something is suppressing propagation. The observed data catches what the model misses: recent solar flare D-layer absorption, elevated Kp degrading polar paths, or simply an anomalous quiet period.
POTA Map and Pathfinder
The POTA (Parks on the Air) map shows live activator spots — operators currently active from parks in the POTA program — overlaid on a propagation-aware map. Spot data updates every 2 minutes from pota.app. For chasers, each activator spot is color-coded by the current band score for a path from your QTH to the park's location: green spots are likely workable, yellow marginal, red probably not reachable under current conditions.
Pathfinder calculates propagation conditions for a specific path between two points entered as callsigns or Maidenhead grid squares. Instead of a generalized band score for all directions from your QTH, Pathfinder computes the MUF for the exact path geometry — accounting for the specific distance, great circle bearing, and midpoint solar angle. Before calling a rare DX station, use Pathfinder to verify that the path from your grid to their location is within the current MUF on your chosen band.
How DXRadar Compares to HamQSL and VOACAP
Honest comparison requires clarity about what each tool does:
| Feature | DXRadar | HamQSL | VOACAP |
|---|---|---|---|
| Data type | Real-time (live SFI + spots) | Calculated averages | Statistical probability |
| Update frequency | 5–10 minutes | Not live | Not live |
| PSKReporter integration | Yes — every 10 min | No | No |
| Path-specific analysis | Yes (Pathfinder) | Simplified | Full ITU-R model |
| POTA integration | Yes — live activator spots | No | No |
| Solar weather detail | Full dashboard + globe | Basic | None |
| Best use case | Current conditions right now | General band planning | Long-term antenna/mode planning |
VOACAP is the authoritative tool for long-term propagation statistics and antenna comparison. If you want the statistical probability that a W5 to JA path will support 20m contacts during October over the next decade, VOACAP is the correct tool. DXRadar does not replace VOACAP for that purpose.
DXRadar answers a different question: what is actually happening right now, and will it still be happening when you sit down at the radio in 15 minutes? That requires live data — current SFI, current Kp, and actual PSKReporter spots — which no static model can provide.
Frequently Asked Questions
What is DXRadar?
DXRadar is a real-time HF propagation tool for licensed amateur radio operators. It combines live NOAA space weather data (SFI, K-index, solar wind) with PSKReporter spot data to calculate and display current band conditions for all major HF bands. Features include a live band board, 3D solar weather globe, dedicated /is-10m-open analysis, POTA activator map, and the Pathfinder path-specific propagation tool.
How accurate is DXRadar's band prediction?
DXRadar's band scores combine an ITU-R P.533-based MUF model with observed PSKReporter spot data. The model provides a theoretical baseline; spots confirm or correct it with actual conditions. No tool can predict sporadic-E openings in advance — those appear in the spot data first, and DXRadar's display updates within 10 minutes. For F2 propagation, model accuracy within 10–15% of the actual MUF is typical under normal conditions.
Is DXRadar free to use?
Yes, DXRadar is free. All features — band conditions, the solar weather dashboard, the 3D globe, the POTA map, and Pathfinder — are available without registration or payment.
How often does DXRadar update?
Solar data (SFI, K-index, solar wind, X-ray flux) updates every 5–10 minutes from NOAA SWPC. PSKReporter spot data updates every 10 minutes. POTA activator spots update every 2 minutes. The 3D solar weather globe refreshes MUF contours and aurora oval data every 5 minutes.