Two Measurements, Two Different Physics
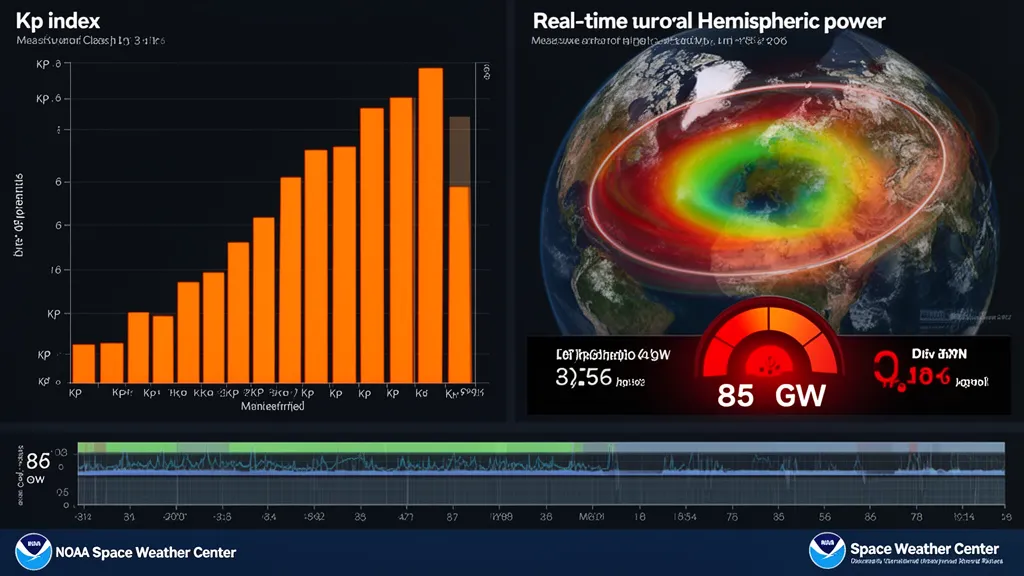
Kp index and Hemispheric Power (HP) both quantify geomagnetic activity, but they measure fundamentally different physical quantities using different instruments, at different cadences, with different spatial characteristics. Understanding both makes you a more informed interpreter of space weather data.
Kp index measures the response of Earth's surface magnetic field to geomagnetic disturbance. It is a ground-based, global average using 13 magnetometer stations. Kp reflects the integrated effect of the ring current, magnetospheric convection, and ionospheric current systems on the horizontal component of Earth's magnetic field at sub-auroral latitudes.
Hemispheric Power measures the actual energy flux of charged particles (primarily electrons with energies of 100 eV to 300 keV) precipitating into the polar ionosphere. It is a satellite-based, direct measurement of particle energy deposition, reported separately for northern and southern polar caps.
The distinction matters operationally. A substorm — a brief, intense burst of magnetospheric energy release confined to the polar zone — can spike HP by 100 GW in minutes while producing only a moderate Kp response, because the substorm's magnetic signature is concentrated at high latitudes and the global average Kp remains low. Conversely, during the main phase of a large geomagnetic storm, Kp and HP track together closely.
How Kp Is Computed: The Quasi-Logarithmic Ground Network
The Kp index derives from a network of 13 magnetometer observatories at sub-auroral geomagnetic latitudes, selected to be geographically distributed and to avoid contamination by the equatorial electrojet and auroral electrojets. The stations include observatories at Niemegk (Germany), Eskdalemuir (Scotland), Hartland (England), Lovö (Sweden), Brorfelde (Denmark), Wingst (Germany), Abisko (Sweden), Lerwick (Scotland), Meanook (Canada), Sitka (Alaska), Eyrewell (New Zealand), Gnangara (Australia), and Kanoya (Japan).
For each 3-hour interval (00–03, 03–06, ... 21–24 UTC), each station calculates a local K-index. The K-index is the maximum range of variation of the horizontal magnetic field component during that interval, converted to a quasi-logarithmic integer from 0 to 9 using a station-specific conversion table. The conversion tables are calibrated to each station's local activity level — a K4 at Eskdalemuir corresponds to the same underlying geomagnetic activity level as K4 at Gnangara, even though their absolute field variations differ.
The Kp scale is quasi-logarithmic. The field variation corresponding to each Kp level approximately doubles with each step:
| Kp | Approximate ΔH (nT) | NOAA G-Scale | Storm Category |
|---|---|---|---|
| 0 | < 5 nT | — | Quiet |
| 1 | ~5 nT | — | Quiet |
| 2 | ~10 nT | — | Quiet |
| 3 | ~20 nT | — | Unsettled |
| 4 | ~40 nT | — | Active |
| 5 | ~80 nT | G1 | Minor storm |
| 6 | ~150 nT | G2 | Moderate storm |
| 7 | ~300 nT | G3 | Strong storm |
| 8 | ~400 nT | G4 | Severe storm |
| 9 | ~500 nT | G5 | Extreme storm |
The Kp value published by GFZ Potsdam is computed as the mean of the 13 station K-indices with standardized weighting. It is published 3 hours after the end of each measurement interval and carries a 3-hour time resolution. The estimated Kp (Kp_est), derived from a real-time subset of stations, is available with approximately 1-hour latency — this is what DXRadar displays as the current Kp.
The 3-hour averaging in Kp can mask brief but intense substorm activity. If you observe aurora visually or on VHF scatter during a period where Kp looks moderate, check whether the 1-minute Dst or SYM-H index from World Data Center for Geomagnetism Kyoto is showing a sharp negative excursion — that reveals magnetospheric injection that the 3-hour Kp smoothes over.
How Hemispheric Power Is Measured: POES Polar Satellites
Hemispheric Power is measured by the NOAA POES (Polar Operational Environmental Satellites) and MetOp satellites, which orbit at approximately 833 km altitude in near-polar, sun-synchronous orbits with an approximately 100-minute orbital period. Each complete orbit provides one pass over each polar region.
The satellites carry Total Energy Detectors (TED) and Medium Energy Proton and Electron Detectors (MEPED), which measure particle energy flux at the satellite altitude. The TED measures precipitating electron and ion flux in the energy range 50 eV to 20 keV. The MEPED measures higher-energy particles up to 300 keV.
HP is computed by integrating the energy flux measurements across all local times in the polar oval during a single orbit, then extrapolating to a full-orbit estimate. The result is published approximately every 30 minutes as an updated HP estimate for each hemisphere.
Because each satellite samples only a narrow swath per orbit, the spatial coverage is incomplete between orbits. This is a key limitation: a substorm occurring between satellite passes may be captured only partially or not at all in the HP estimate. The ~30-minute cadence and incomplete spatial sampling mean HP has both higher time resolution and higher spatial uncertainty than Kp.
The HP–Kp Empirical Relationship
NOAA has published empirical conversion relationships between HP and Kp for use in operational forecasting. These are heuristic relationships with significant scatter, not rigid physical laws.
NOAA's standard HP–Kp conversion:
| Kp | North HP (GW) | South HP (GW) |
|---|---|---|
| 0 | 3 | 3 |
| 1 | 8 | 8 |
| 2 | 14 | 14 |
| 3 | 22 | 22 |
| 4 | 38 | 38 |
| 5 | 60 | 60 |
| 6 | 105 | 105 |
| 7 | 180 | 180 |
| 8 | 335 | 335 |
| 9 | 500 | 500 |
Important caveats:
- HP can differ significantly between northern and southern hemispheres during asymmetric geomagnetic configurations
- Substorms can produce HP 150–200 GW while Kp remains at 4–5 due to the 3-hour averaging window
- The relationship is most reliable during the main phase of large storms; it breaks down during substorm phases
Operator's Verdict: The threshold Kp values that matter — Kp5 (G1, HF begins degrading at high latitudes), Kp7 (G3, HF unreliable on many paths), Kp9 (G5, near-total HF blackout) — are published, standardized, and directly tied to the NOAA G-scale. HP provides useful supplemental context but requires interpretation.
Hemispheric Power and the Aurora Oval
HP is the primary input to NOAA's real-time auroral oval model (the ovation model), which projects the equatorward boundary of the aurora oval from the measured particle energy deposition. This is what drives the animated aurora oval maps on DXRadar and NOAA's Aurora 3-Day Forecast.
As HP increases, the oval expands equatorward. The practical implications for radio operators:
Auroral absorption (distinct from the aurora phenomenon itself) affects HF paths transiting through the auroral oval. As the oval expands equatorward with increasing HP, HF paths through higher mid-latitudes come within the absorption zone. An operator in central England (geographic latitude ~52°N, geomagnetic ~56°N) may find 20m paths to North America degraded at HP 150 GW that are perfectly clear at HP 50 GW.
VHF aurora scatter on 6m and 2m requires the auroral oval to be close to or overhead the operating station. The oval's position, driven by HP, determines whether aurora scatter contacts are geometrically possible for a given station pair.
Substorms: When HP and Kp Diverge
Substorms are the most operationally significant scenario where HP and Kp diverge. A substorm is a brief (30–60 minute) explosive energy release in the magnetotail, driving intense auroral activity and particle precipitation concentrated in the polar zone.
During a substorm:
- HP can spike from 40 GW to 200+ GW in 5–10 minutes
- Visual aurora intensifies rapidly in the polar cap
- The local magnetometer at a high-latitude station shows a sharp negative bay
- Kp may increase by only 1–2 units because the disturbance is localized and the 3-hour average is contaminated by the quieter pre-substorm period
For operators pursuing aurora scatter on 2m, a substorm signature in HP data is a reliable indicator of intensified scatter conditions that may not yet be reflected in the reported Kp. Monitoring HP directly from NOAA POES data — updated every ~30 minutes — provides earlier notice of substorm-driven opportunities than waiting for the next 3-hour Kp estimate.
Reading Both Metrics on DXRadar
DXRadar's solar weather dashboard displays the current Kp index, estimated in near-real time from the GFZ data stream. The aurora dashboard provides the NOAA OVATION model output, which is driven by HP measurements.
Practical workflow for a geomagnetic storm watch:
- Kp 4 (active): Monitor closely. High-latitude HF paths (North America to Scandinavia, transpolar routes) starting to degrade.
- Kp 5 (G1): Switch to lower HF frequencies for high-latitude paths. VHF aurora scatter possible if you are within 5°–10° of the oval boundary.
- Kp 6 (G2): HF above 20m unreliable on polar-adjacent paths. Check HP for whether the oval has expanded to your latitude.
- Kp 7 (G3): Global HF significantly degraded. 40m and lower NVIS most reliable for regional work. Aurora scatter actively usable for stations below the oval.
- Kp 8–9 (G4–G5): Prepare for near-total HF blackout on many paths. Lower bands and NVIS offer residual capability.
Frequently Asked Questions
What is Hemispheric Power in space weather?
Hemispheric Power is the total energy deposited into the polar ionosphere by precipitating auroral particles, measured in gigawatts. It is measured by NOAA POES and MetOp satellites in polar orbit, updated approximately every 30 minutes, and reported separately for northern and southern polar regions. Typical quiet-time HP is 5–15 GW; major storms can reach 300–500 GW.
What is the relationship between Kp index and Hemispheric Power?
NOAA's empirical relationship: Kp3 ≈ 22 GW, Kp5 ≈ 60 GW, Kp7 ≈ 180 GW, Kp9 ≈ 500 GW. However, the relationship has significant scatter. Substorms can spike HP to 200+ GW while Kp remains at 4–5 because the 3-hour Kp averaging window smoothes brief polar events.
Which should I use for ham radio operating decisions — Kp or Hemispheric Power?
Kp for most HF operating decisions — it is the standard, widely published metric with a direct NOAA G-scale mapping. HP is more useful if you are specifically tracking aurora oval expansion for VHF aurora scatter opportunities, or monitoring for substorm activity between 3-hour Kp updates.
How is the Kp index measured?
Kp derives from 13 ground magnetometer observatories at sub-auroral latitudes. Each station measures the maximum range of horizontal field variation during a 3-hour interval and converts to a local K-index. GFZ Potsdam combines these into the planetary Kp using a standardized averaging scheme. The result is published every 3 hours.
What does Hemispheric Power tell me about aurora visibility?
Higher HP means the auroral oval expands equatorward, bringing visible aurora to lower latitudes. At HP ~40–50 GW (Kp5), aurora is possible at geomagnetic latitude 60°. At HP 200+ GW (Kp7), aurora can reach geomagnetic latitude 50°, which is geographic latitude ~55°N in North America. NOAA's oval model, driven by HP, provides the best real-time visualization of oval extent.