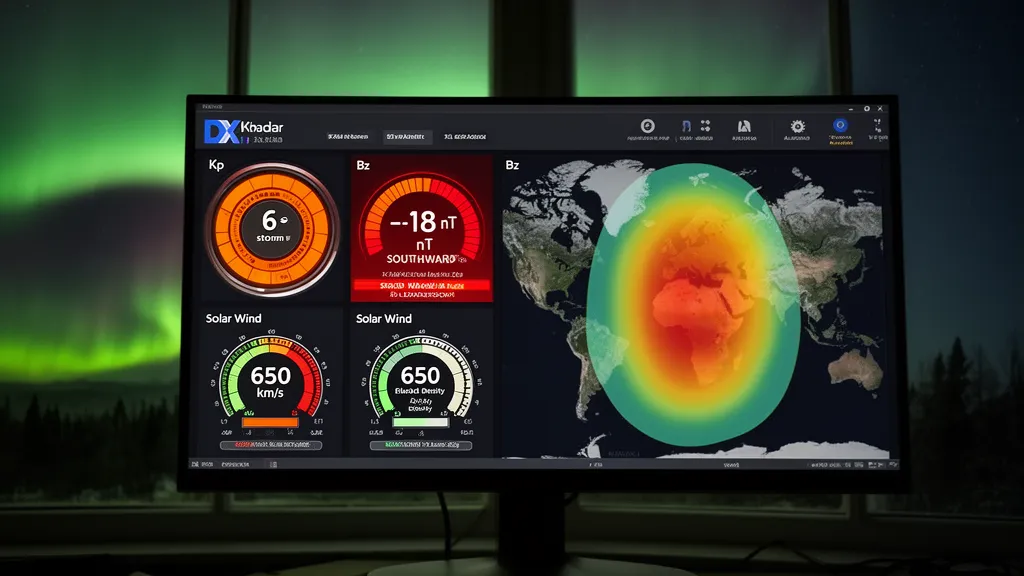
Operator's Verdict: Kp shows current geomagnetic storm level (0–9); Bz tells you if a storm is developing (negative Bz = warning); solar wind speed indicates energy arriving at Earth. For radio: Kp below 3 = ideal propagation; Kp 5+ = polar paths disrupted. Check the aurora dashboard before any long-distance HF operating session.
The Aurora Dashboard at a Glance
DXRadar's aurora dashboard at /solar-weather/aurora collects five key space weather parameters into a single view optimised for radio operators:
- Kp Gauge — current geomagnetic storm level
- Bz Indicator — interplanetary magnetic field direction
- Solar Wind Panel — speed, density, and temperature
- HF Impact Panel — plain-language propagation impact assessment
- Aurora Oval Map — predicted aurora footprint
Each panel is described in detail below.
Pro Tip: Monitor DXRadar's solar weather dashboard for real-time space weather data — check it before every operating session.
The Kp Gauge
The Kp gauge shows the current planetary K index on a scale of 0–9. Colour zones:
| Kp Range | Colour | NOAA Scale | Radio Impact |
|---|---|---|---|
| 0–2 | Green | G0 (quiet) | Excellent; all paths |
| 3–4 | Yellow | G0–G1 | Minor; polar paths may show slight degradation |
| 5 | Orange | G1 (storm) | Polar paths disrupted; auroras possible at 60°N |
| 6–7 | Red | G2–G3 | Significant disruption; auroras to 50°N |
| 8–9 | Deep red | G4–G5 | Severe; widespread HF degradation |
What to do with this information:
If Kp is 0–2, all planned HF contacts are likely to work. If Kp is 5–6, avoid polar-path skeds (e.g., Europe–Japan via polar route) and expect degradation on 40m at high latitudes. If Kp is 7+, check DXRadar's band status pages for real-time band conditions before calling CQ.
The Kp gauge also shows the 3-hour history as a bar chart — allowing you to see whether Kp is rising (storm developing) or falling (storm recovering).
The Bz Indicator
Bz (the z-component of the interplanetary magnetic field) is displayed as a gauge and time series chart. This is the most important predictive parameter for geomagnetic storms.
Reading Bz:
- Positive (northward): Green zone. Protective configuration. Even if solar wind speed is high, a northward Bz reduces storm risk.
- Near zero: Watch zone. Fluctuating around zero means conditions can shift rapidly.
- Negative (southward): Red zone. The magnetosphere is coupling with the solar wind. The more negative and sustained, the stronger the eventual storm.
Storm warning interpretation:
- Bz −5 to −10 nT for 30 minutes → Kp 4–5 likely within 1–2 hours
- Bz −15 to −25 nT for 60+ minutes → Kp 7–8 storm likely
- Bz −30 nT or more → Major G4–G5 storm possible
Bz changes can be rapid — the gauge can swing from +10 to −20 nT in minutes as solar wind structure passes DSCOVR. Watching the Bz time series shows the history and trend clearly.
The Solar Wind Panel
The solar wind panel displays three measurements from the NOAA DSCOVR satellite:
Solar wind speed (km/s):
- Nominal: 300–500 km/s
- Elevated: 600–700 km/s (coronal hole high-speed stream or post-CME)
- High: >800 km/s (strong CME impact)
Speed enhances the geomagnetic impact of any southward Bz — a Bz of −10 nT at 800 km/s solar wind speed causes a larger storm than the same Bz at 400 km/s.
Solar wind density (particles/cm³):
- Nominal: 3–8 /cm³
- Enhanced: 10–20 /cm³ (ahead of or during CME passage)
- High: >30 /cm³ (very dense, often associated with sheath regions before CME)
Proton temperature: Less commonly used by radio operators but completes the plasma characterisation.
The HF Impact Panel
The HF Impact Panel translates raw space weather data into plain-language propagation impact:
Examples:
- "Polar paths likely degraded — K5 storm in progress"
- "All paths normal — quiet conditions"
- "High solar wind speed — monitor Bz for storm potential"
- "Post-flare absorption possible on 40m/80m — X1.2 flare 40 minutes ago"
This panel is DXRadar's synthesised interpretation for radio operators, combining multiple inputs (Kp, Bz, SFI, X-ray flux) into actionable guidance.
Practical Scenarios
Before a DXpedition contact
Planning a 20m contact to a rare DX station at 14,000 km over a polar path? Check:
- Kp gauge: Is it below 4? If yes, proceed.
- Bz: Is it positive or near zero? If yes, the next few hours should be stable.
- If Kp is 5+ or Bz is deeply negative, try a different band or wait — polar paths will be poor.
During a contest weekend
Check the aurora dashboard on the first morning of the contest. If Kp is rising and Bz is negative, high-band polar contacts will be difficult. Redirect effort to lower bands (40m, 80m) and non-polar paths where the storm has less impact.
For aurora viewing
If the Kp gauge is showing 5+ and your location is at or above 55°N, check the aurora oval map on the dashboard. If your location is within the oval, step outside after dark and look north. Clear skies + Kp 5+ at your latitude = high aurora visibility probability.
The aurora dashboard is available at DXRadar's Aurora Page with all panels updating automatically.
Frequently Asked Questions
What is the Kp index and what does it mean for radio?
The Kp index (planetary K index) is a global 3-hourly measure of geomagnetic activity, ranging from 0 (completely quiet) to 9 (severe geomagnetic storm). For radio: Kp 0–2 means excellent propagation on all bands including polar paths. Kp 3–4 means minor disturbance — most paths unaffected but high-latitude paths may show slight absorption. Kp 5 (G1 storm) causes moderate polar path disruption. Kp 6–7 (G2–G3) causes significant high-latitude disruption; mid-latitude operators may notice polar path degradation. Kp 8–9 (G4–G5) causes widespread HF degradation even at mid-latitudes and can produce radio blackouts on polar paths.
What is Bz and why does it matter?
Bz is the north-south component of the interplanetary magnetic field (IMF) carried in the solar wind. When Bz points southward (negative values), it couples with Earth's magnetic field, allowing energy transfer from the solar wind into the magnetosphere — this drives geomagnetic storms. When Bz points northward (positive values), the coupling is inhibited and the magnetosphere is protected. In practice: if Bz is negative and sustained at -10 nT or below for more than 30–60 minutes, a significant geomagnetic storm (Kp 5+) is likely within the next few hours. This makes Bz the earliest warning of incoming storm conditions — often 1–2 hours before Kp readings reflect the storm.
How do I know if aurora is visible from my location tonight?
DXRadar's aurora dashboard shows the OVATION model's 30-minute aurora forecast. If your location falls within or near the predicted aurora oval on the map, aurora visibility is possible. Additional requirements: it must be dark at your location (night-time), skies must be clear, and light pollution low. The Kp threshold for aurora visibility at specific latitudes: Kp 5 = visible at 60°N (Scotland, Scandinavia, southern Canada); Kp 7 = visible at 50°N (England, Germany, northern USA); Kp 9 = visible as far as 40°N (France, mid-USA). The aurora dashboard's Kp gauge shows current Kp against these thresholds.
What is solar wind speed and why is it relevant?
Solar wind speed (measured by NOAA's DSCOVR satellite) indicates the velocity of the plasma stream arriving at Earth. Typical background solar wind is 300–500 km/s. Enhanced solar wind (600–800 km/s) arrives after solar flares, CMEs, and during high-speed streams from coronal holes. High solar wind speed compresses the magnetosphere, increasing the likelihood of geomagnetic activity — but speed alone doesn't cause storms. The combination of high speed AND southward Bz is the most storm-effective configuration. Solar wind speed is displayed in the DXRadar aurora dashboard alongside Bz and density panels.
How often does the aurora dashboard update?
Individual panels update at different rates: Solar wind speed and Bz from DSCOVR update every 1 minute. Kp index updates every 3 hours when a new planetary K estimate is published by NOAA. The aurora oval forecast (OVATION model) updates every 30 minutes. The dashboard automatically fetches new data without requiring page refresh. When a rapid change in space weather occurs (solar flare, CME impact), the solar wind panels will show the change within 1–2 minutes of it arriving at DSCOVR satellite position.